VPIN Study
Order-flow imbalance measured on a volume clock
Methodology & Operational Notes
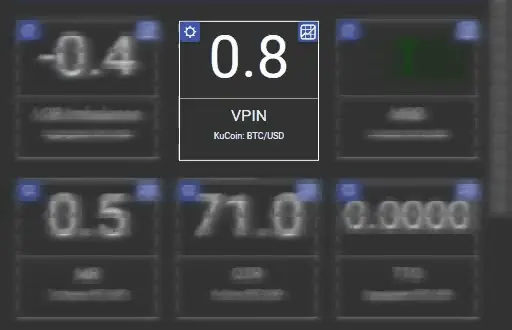
VPIN (Volume-Synchronized Probability of Informed Trading) measures order-flow imbalance on a volume clock. Trades are grouped into buckets of equal traded volume. For each bucket we take the volume bought by aggressors minus the volume sold by aggressors, and show the average absolute imbalance over the last n buckets, on a 0-1 scale: 0 means every bucket was balanced, 1 means every bucket was one-sided.
Despite its name it is not a probability, and it is not a warning signal. Andersen and Bondarenko (2014, 2015) showed that the metric's forecasting record came from its original classifier tracking volatility rather than from informed trading. Read it as a description of how one-sided recent flow has been, not as a forecast.
Bucket volume decides the number. Small buckets read high on random flow by arithmetic alone: with four equally sized trades per bucket the average on coin-flip sides is 0.375, with two it is 0.500, and with one it is 1.000. Size the bucket from the instrument's daily volume, as the original paper does, and aim for at least 20 trades per bucket.
An optional corrected form classifies each trade by the tick rule - a print above the previous print is a buy, below is a sell - which Chakrabarty, Pascual and Shkilko (2015) found more accurate than the paper's own bulk classifier. It shows no value until a full window of buckets has closed, and none while the bucket volume is too small to hold 20 trades.