Topic: #Market Microstructure
Explore 18 technical VisualHFT guides and engineering analyses tagged Market Microstructure, covering live order books and trading infrastructure.
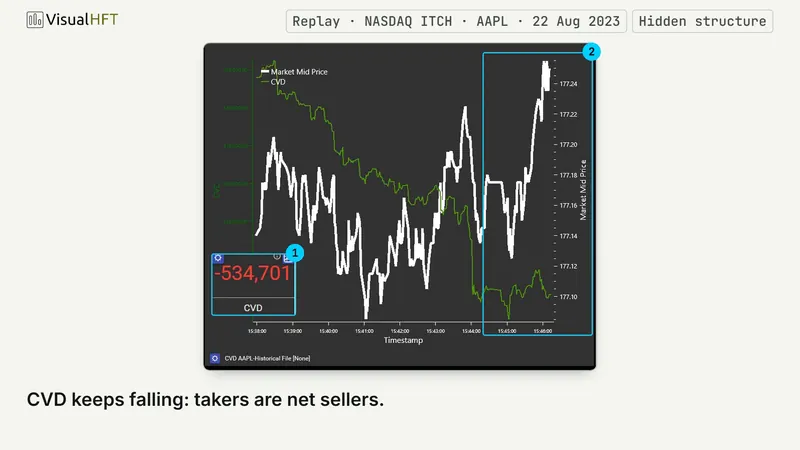
CVD Inside the Order Flow Dynamics Desk: Who Led the Session, and When Price Stopped Agreeing
Cumulative Volume Delta adds up who took liquidity since the session started. Its sign says who led, its slope says who leads now, and its divergence from price shows the tape and the price disagreeing. Here is how to read all three on the Order Flow Dynamics Desk.
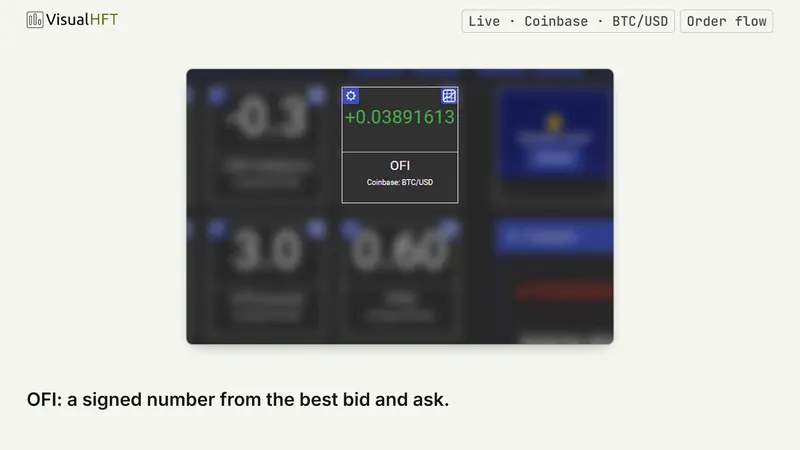
OFI Inside the Order Flow Dynamics Desk: See the Book Lean Before the Quote Ticks
Order Flow Imbalance is one tile on the Order Flow Dynamics Desk, the surface that answers one question: who is pressing, how hard? OFI shows where pressure is building at the top of book, every 100 ms. Here is how to read its lean, persistence, shifts and quiet, and what to read it with.
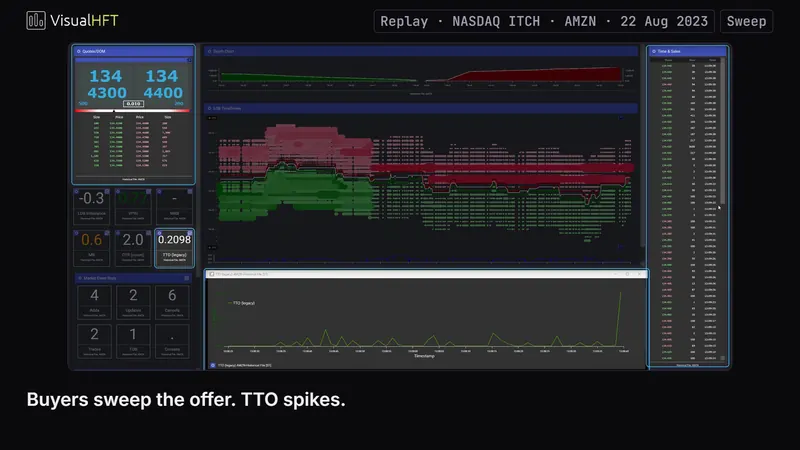
From Signal to Trade, Part 2: Reading Book Churn and Sweeps on the Screen
Part 2 of the series: two order-flow tiles a desk reads for context. OTR flags a book that churns while nothing trades; TTO makes many sweeps visible at a glance.
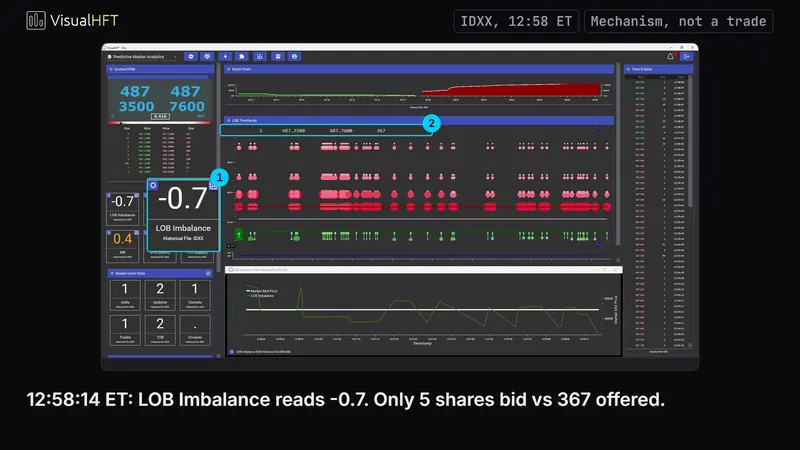
From Signal to Trade, Part 1: Turning Book Imbalance and Toxicity into Desk Rules
Why a 73.9% directional hit rate still loses to the spread when traded alone, how Touch-Weighted LOB Imbalance lifts reversal entries to 78.2%, and how to automate multi-tile alerts in the VisualHFT Trigger Engine.
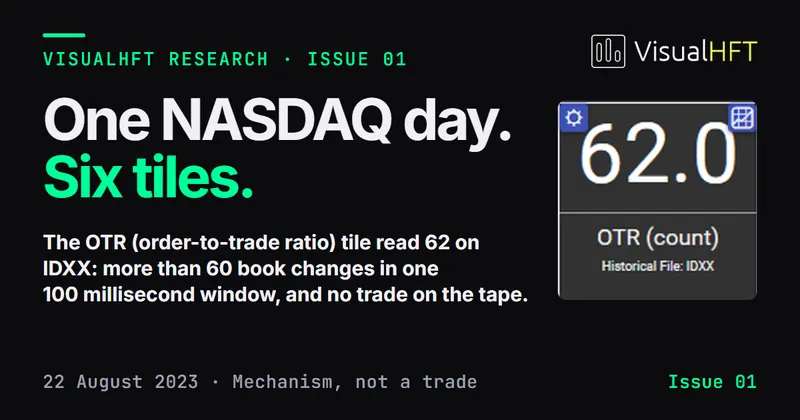
VisualHFT Research, Issue 01: One NASDAQ day, six tiles
Issue 01 of VisualHFT Research, as a PDF: two settings of the LOB Imbalance tile compared on ten liquid NASDAQ symbols, a guide to reading the captures, and a map of the fourteen spreads.
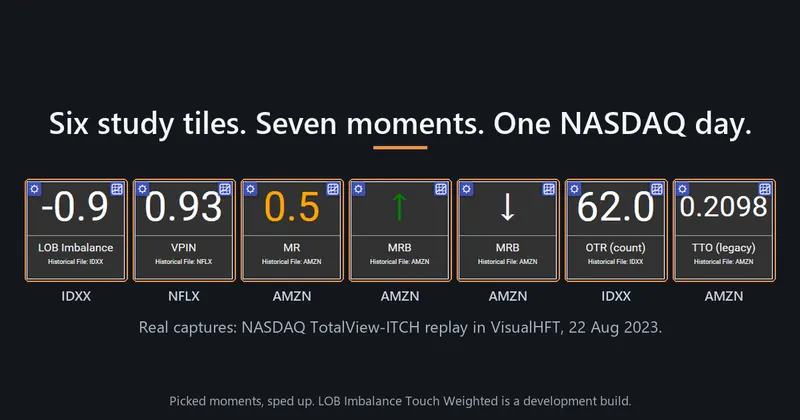
Six Study Tiles, One NASDAQ Day: The Theory, the Screen, and What the Data Supports
We replayed a full NASDAQ TotalView-ITCH trading day through VisualHFT, captured each study tile doing what its research says it should, walked through every pause, and tested each tile against a free rule on symbols held out from the design.
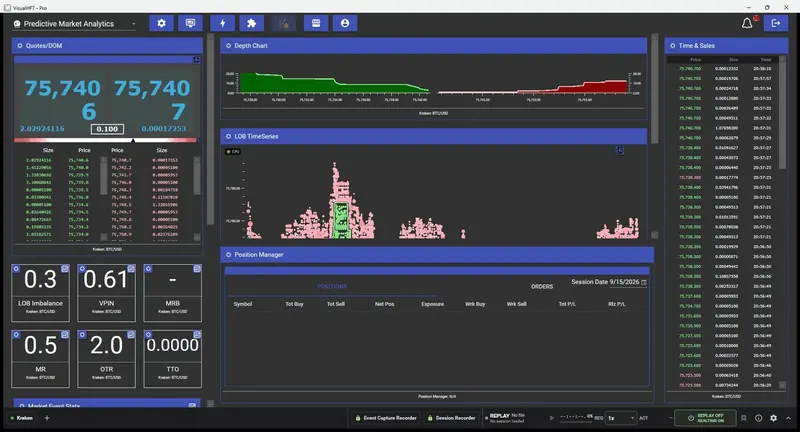
Order-book imbalance and the next ten seconds
We recorded VisualHFT against live Kraken BTC/USD twice, measured whether each study tile said anything about the next price move, and then spent longer trying to break the answer than we spent finding it.
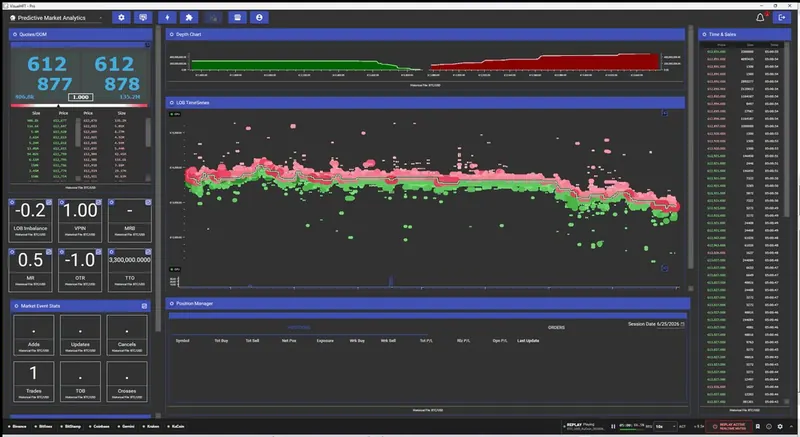
Bring Your Own Historical Market Data: A New VisualHFT Guide
A new documentation guide covers every way to get captured market data into VisualHFT: NASDAQ TotalView-ITCH pcap, FIX 4.2 logs, VisualHFT's own recorders, and a converter you can write in an afternoon for anything else.
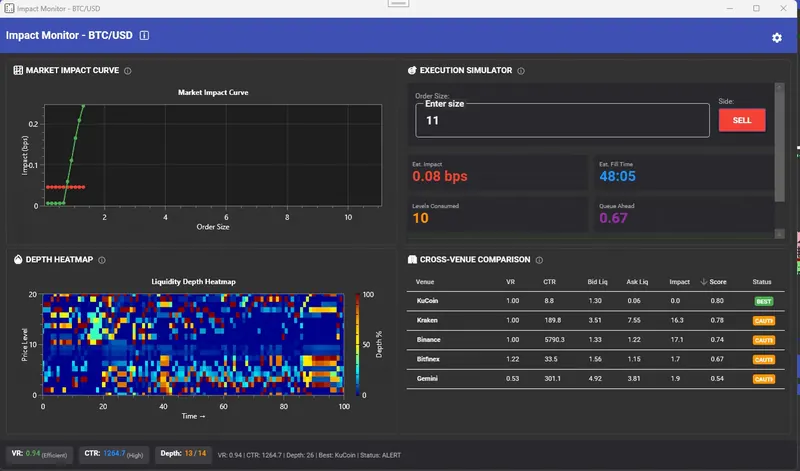
Inside the VisualHFT Private Beta: From Market Data to Execution Decisions
First published on July 22, 2026, this product deep dive follows the complete workflow from raw market data and pre-trade analysis through event replay and execution diagnostics.
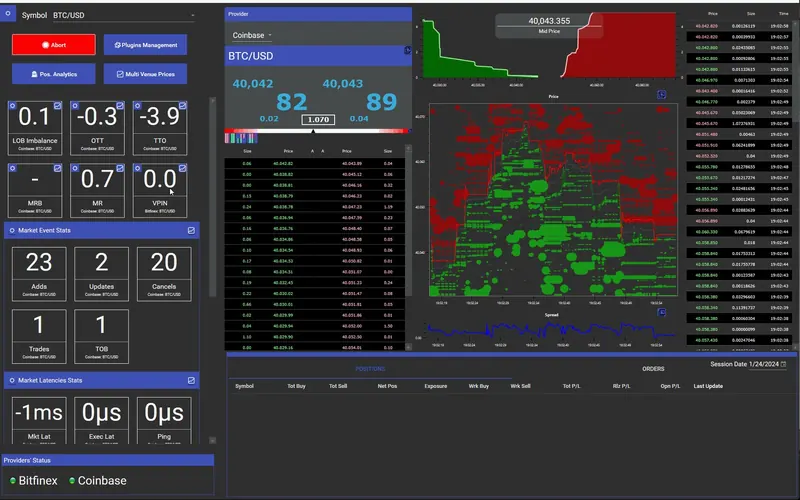
The Six-Signal Microstructure Cascade: How VisualHFT Instruments the Full Second Before the Print
Cancel-side asymmetry, refresh-latency p95 widening, VPIN elevation, multi-level LOB shift, spread widening, then the print. Each signal has a name, a plugin, and a GIF. Here is the full cascade as VisualHFT instruments it in real time.
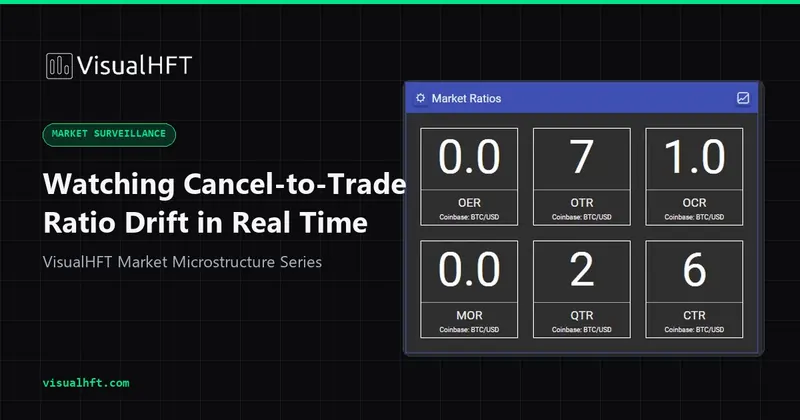
Watching Cancel-to-Trade Ratio Drift in Real Time: What Batch Reports Miss Before the Flag Arrives
A 14:1 daily mean hides 3-minute intraday windows at 60:1 where messaging-fee tiers trip and exchange surveillance queues flag quote-stuffing-adjacent activity. Here is why CTR at sub-second cadence, segmented by side and depth, reads as a different metric than its end-of-day aggregate, and how VisualHFT renders it live.
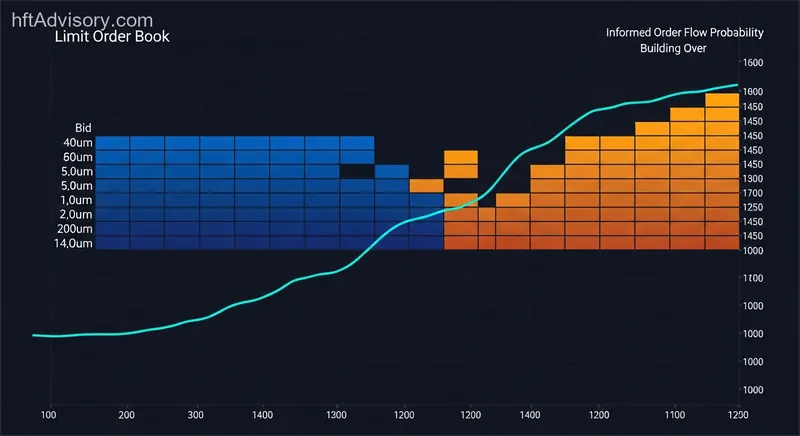
VPIN and Real-Time Order Toxicity: What Your Execution Stack Cannot See Before the Fill
VPIN and LOB imbalance signal informed order flow before the price print moves. Here is why your execution stack is blind to it — and how VisualHFT changes that with real-time, auditable microstructure analytics.
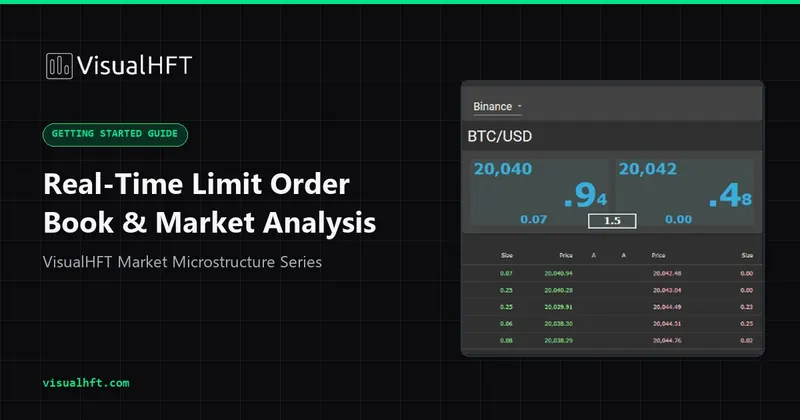
Getting Started with the Open-Source VisualHFT Application
Build the open-source VisualHFT application, connect public market data, inspect its studies, and extend it with the public SDK templates.

Trade Surveillance in Modern Financial Markets
As financial markets continue to evolve, the role of sophisticated trade surveillance systems like VisualHFT becomes increasingly crucial. By integrating advanced technological capabilities with a deep understanding of market dynamics, VisualHFT stands at the forefront of efforts to maintain transparency, ensure compliance, and uphold the integrity of the financial markets.

Volume-Synchronized Probability of Informed Trading (VPIN)
This article explores the Volume-Synchronized Probability of Informed Trading (VPIN), a metric enhancing market analysis by measuring trade volume imbalances. Developed by Easley, López de Prado, and O'Hara, it's crucial for detecting informed trading and market sentiment, particularly in volatile markets. VPIN's significance is highlighted in studies like the 2010 Flash Crash analysis. Its real-time application in market surveillance and forecasting volatility, especially in high-frequency trading, marks a significant advancement in financial analytics.

The Art and Science of Market Resilience in Trading Strategies
Market Resilience (MR) has emerged as a pivotal metric in the field of trading analytics platforms, offering a real-time gauge of market stability following significant trades. This metric is particularly relevant for traders and financial analysts who rely on real-time trading analytics to make swift, informed decisions in a dynamic market environment.

Leveraging Limit Order Book Imbalances for Profitable Trading: A Deep Dive into Recent Research and Practical Tools
In this article, we’ll explore these questions in depth. We’ll dive into recent academic research that has investigated the potential of LOB imbalances as a trading signal. We’ll dissect these studies, understanding their methodologies, dissecting their results, and drawing out their conclusions. Our journey will take us through the intricacies of trade arrival dynamics, the price impact of order book events, and the predictive power of queue imbalances.
A story of how VisualHFT was born
Discover the story behind VisualHFT: From its inception as a vital tool for high-frequency trading to its evolution into a comprehensive platform for market analysis and surveillance. Explore how VisualHFT bridges the gap between complex market data and actionable insights, offering innovative solutions for traders and financial professionals.