Topic: #Order Book
Explore 8 technical VisualHFT guides and engineering analyses tagged Order Book, covering live order books and trading infrastructure.
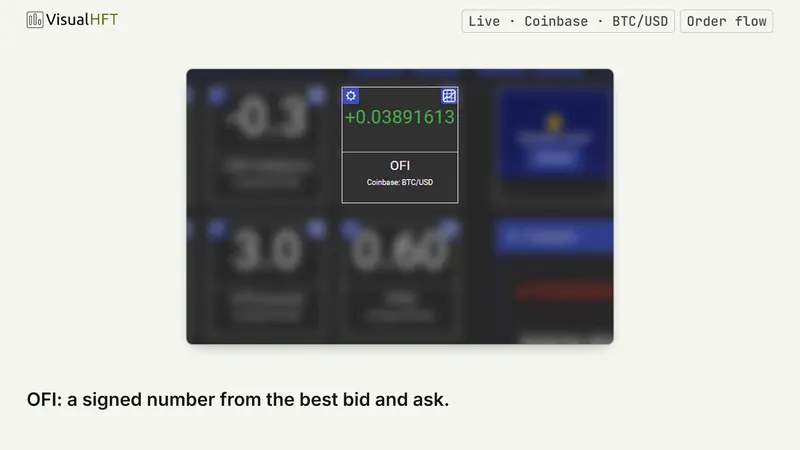
OFI Inside the Order Flow Dynamics Desk: See the Book Lean Before the Quote Ticks
Order Flow Imbalance is one tile on the Order Flow Dynamics Desk, the surface that answers one question: who is pressing, how hard? OFI shows where pressure is building at the top of book, every 100 ms. Here is how to read its lean, persistence, shifts and quiet, and what to read it with.
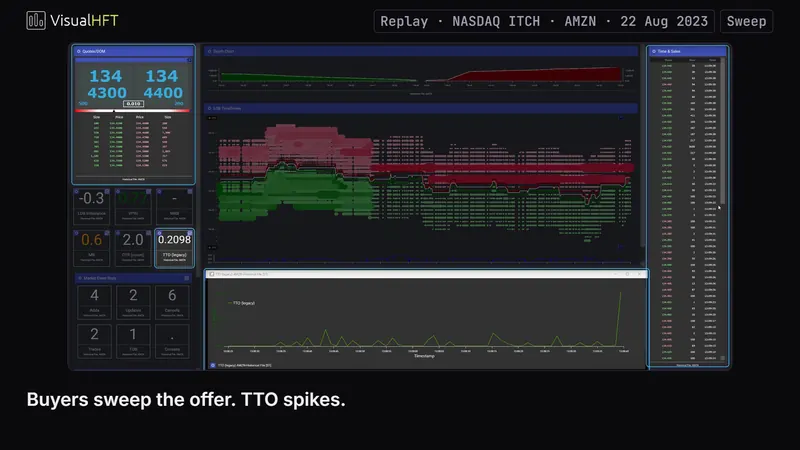
From Signal to Trade, Part 2: Reading Book Churn and Sweeps on the Screen
Part 2 of the series: two order-flow tiles a desk reads for context. OTR flags a book that churns while nothing trades; TTO makes many sweeps visible at a glance.
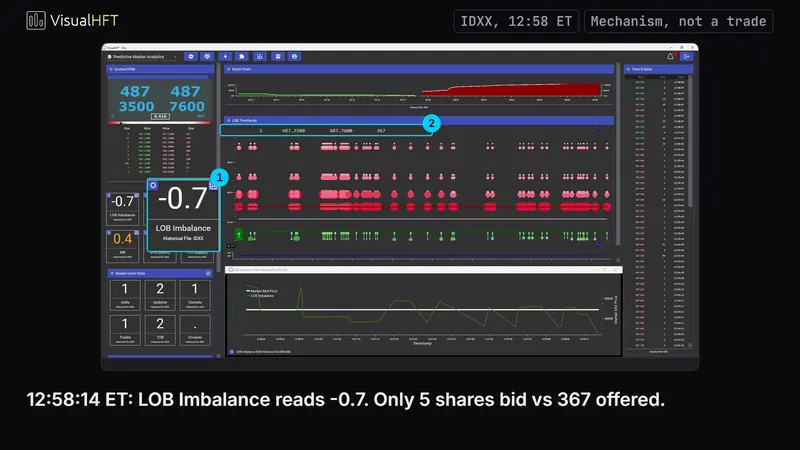
From Signal to Trade, Part 1: Turning Book Imbalance and Toxicity into Desk Rules
Why a 73.9% directional hit rate still loses to the spread when traded alone, how Touch-Weighted LOB Imbalance lifts reversal entries to 78.2%, and how to automate multi-tile alerts in the VisualHFT Trigger Engine.
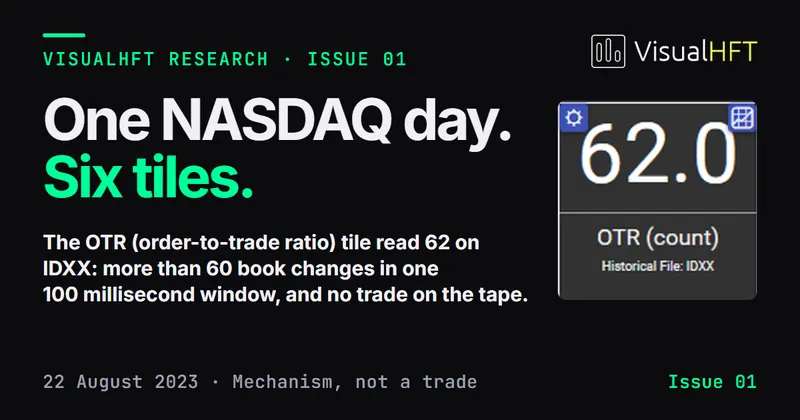
VisualHFT Research, Issue 01: One NASDAQ day, six tiles
Issue 01 of VisualHFT Research, as a PDF: two settings of the LOB Imbalance tile compared on ten liquid NASDAQ symbols, a guide to reading the captures, and a map of the fourteen spreads.
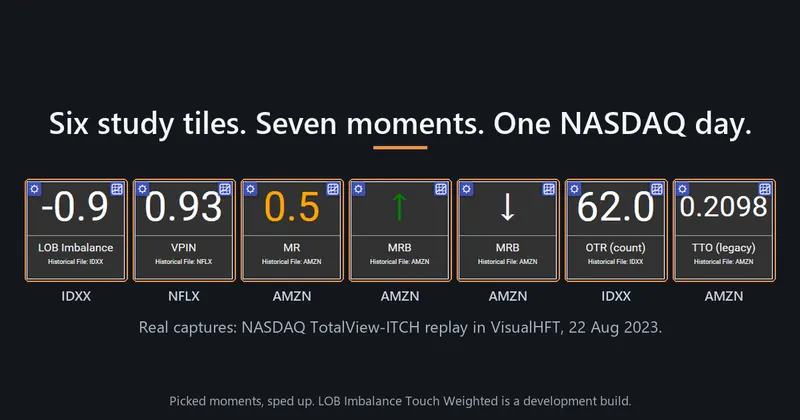
Six Study Tiles, One NASDAQ Day: The Theory, the Screen, and What the Data Supports
We replayed a full NASDAQ TotalView-ITCH trading day through VisualHFT, captured each study tile doing what its research says it should, walked through every pause, and tested each tile against a free rule on symbols held out from the design.
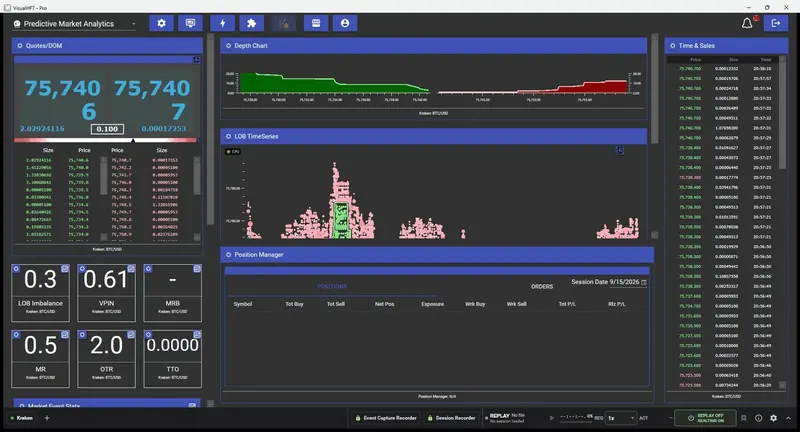
Order-book imbalance and the next ten seconds
We recorded VisualHFT against live Kraken BTC/USD twice, measured whether each study tile said anything about the next price move, and then spent longer trying to break the answer than we spent finding it.
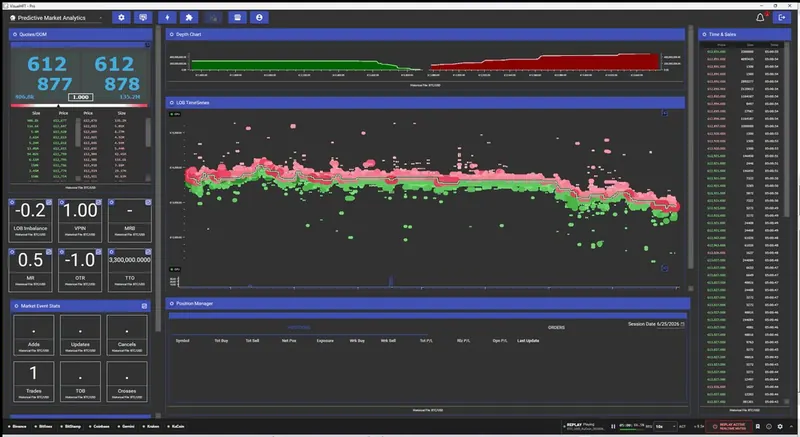
Bring Your Own Historical Market Data: A New VisualHFT Guide
A new documentation guide covers every way to get captured market data into VisualHFT: NASDAQ TotalView-ITCH pcap, FIX 4.2 logs, VisualHFT's own recorders, and a converter you can write in an afternoon for anything else.
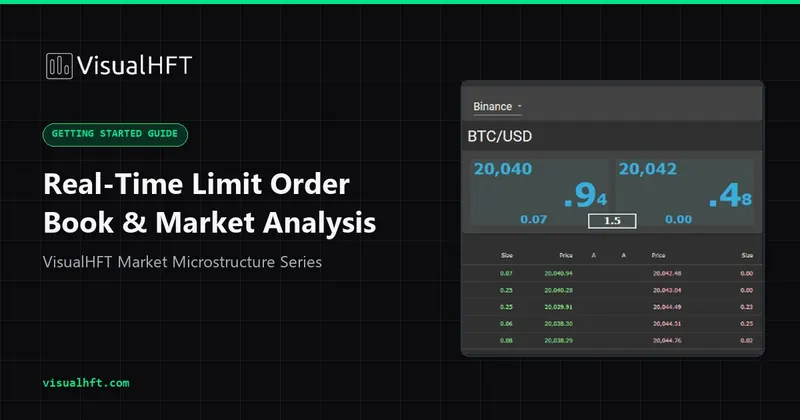
Getting Started with the Open-Source VisualHFT Application
Build the open-source VisualHFT application, connect public market data, inspect its studies, and extend it with the public SDK templates.