Topic: #VisualHFT
Explore 9 technical VisualHFT guides and engineering analyses tagged VisualHFT, covering live order books and trading infrastructure.
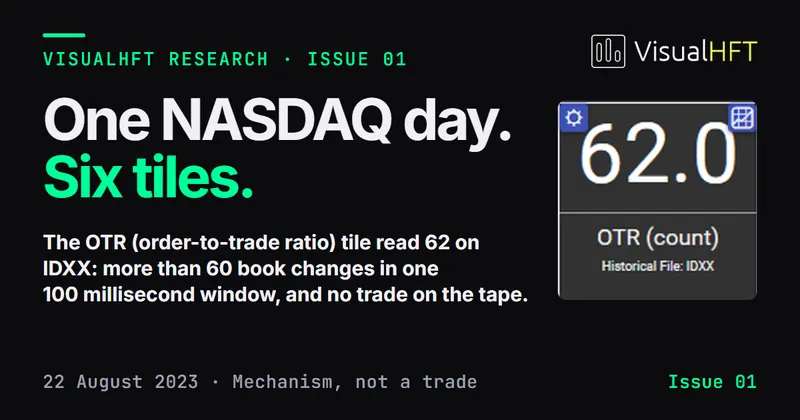
VisualHFT Research, Issue 01: One NASDAQ day, six tiles
Issue 01 of VisualHFT Research, as a PDF: two settings of the LOB Imbalance tile compared on ten liquid NASDAQ symbols, a guide to reading the captures, and a map of the fourteen spreads.
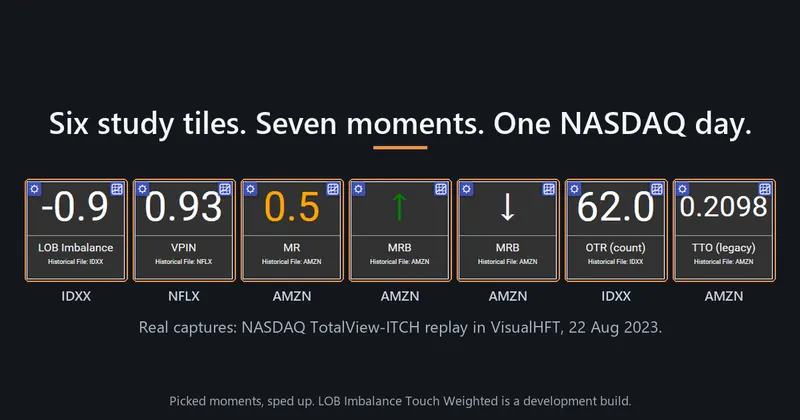
Six Study Tiles, One NASDAQ Day: The Theory, the Screen, and What the Data Supports
We replayed a full NASDAQ TotalView-ITCH trading day through VisualHFT, captured each study tile doing what its research says it should, walked through every pause, and tested each tile against a free rule on symbols held out from the design.
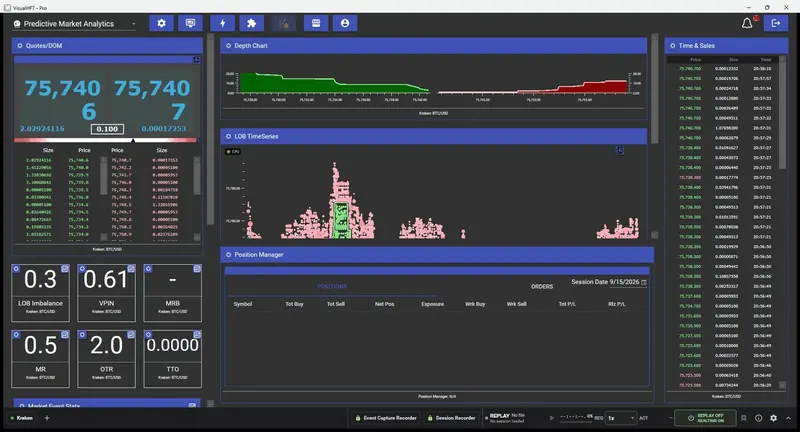
Order-book imbalance and the next ten seconds
We recorded VisualHFT against live Kraken BTC/USD twice, measured whether each study tile said anything about the next price move, and then spent longer trying to break the answer than we spent finding it.
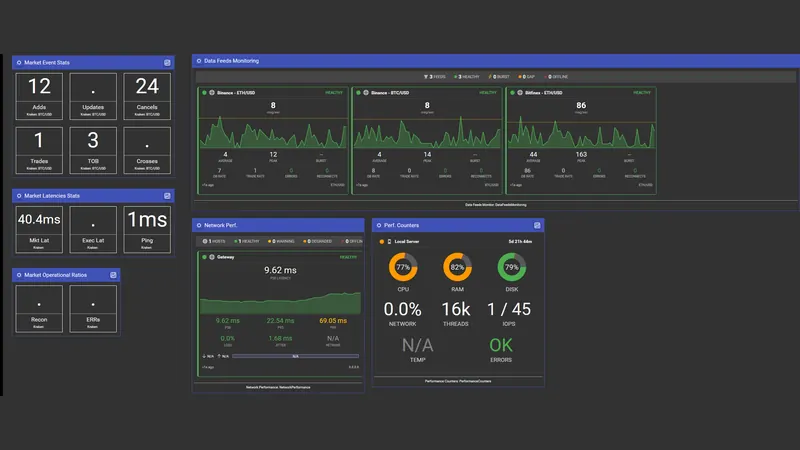
The Healthiest Tile on the Screen Is the One Doing Nothing
When a feed degrades, the message rate and the latency both tell you something is wrong. Neither tells you which kind of wrong. Two counters that sit still all day separate a live session the connector is fighting to keep from a setup step that never completed, and they are the pair nobody watches.
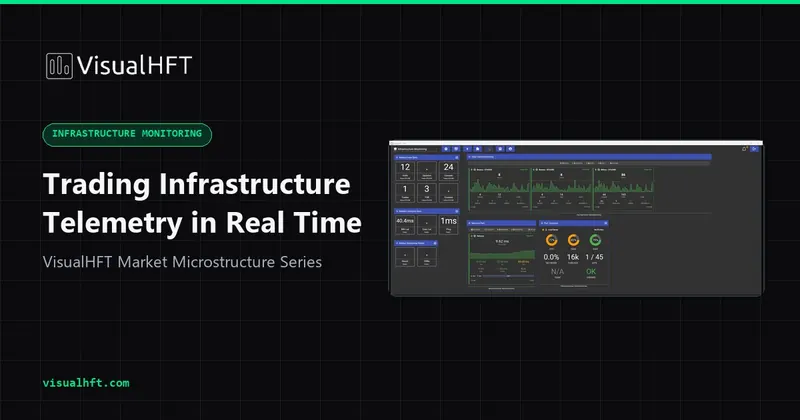
A Stale Feed Looks Exactly Like a Calm Market: Monitoring Trading Infrastructure in Real Time
Trading infrastructure fails in disguise: a dead feed reads as a quiet market, a filling disk reads as venue latency, a corrupted book reads as a trading signal. A walkthrough of the measurements that separate them, and the VisualHFT dashboard that puts all of them on one screen.
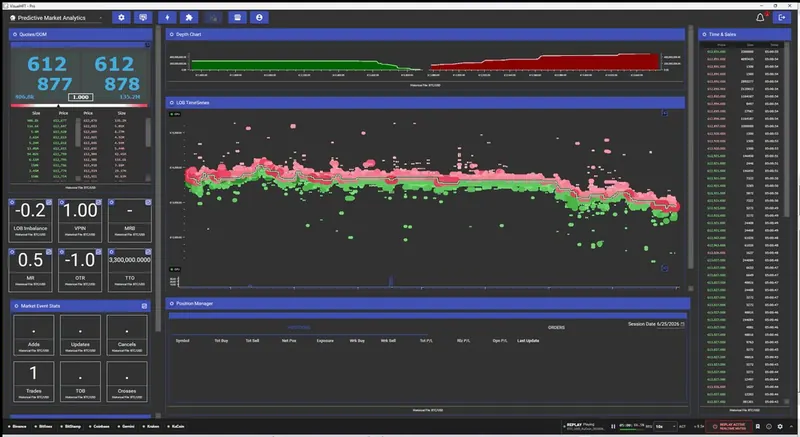
Bring Your Own Historical Market Data: A New VisualHFT Guide
A new documentation guide covers every way to get captured market data into VisualHFT: NASDAQ TotalView-ITCH pcap, FIX 4.2 logs, VisualHFT's own recorders, and a converter you can write in an afternoon for anything else.
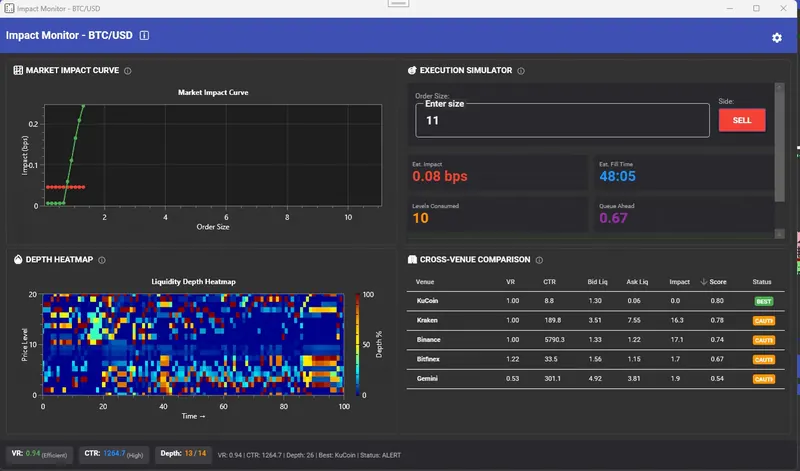
Inside the VisualHFT Private Beta: From Market Data to Execution Decisions
First published on July 22, 2026, this product deep dive follows the complete workflow from raw market data and pre-trade analysis through event replay and execution diagnostics.
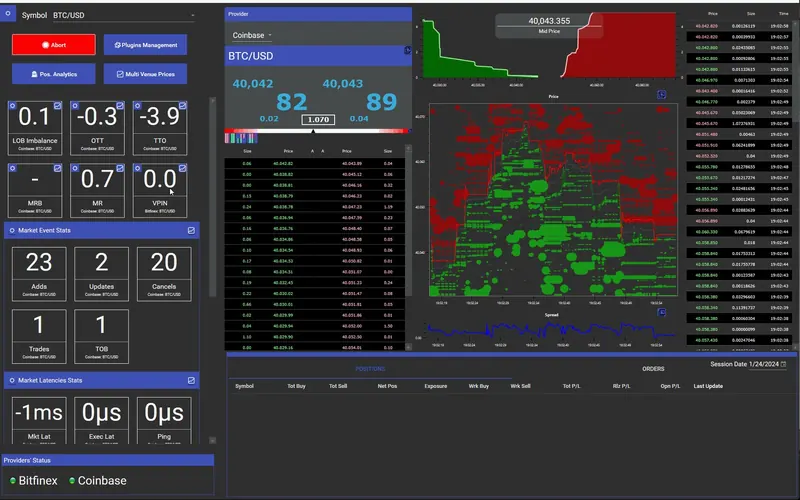
The Six-Signal Microstructure Cascade: How VisualHFT Instruments the Full Second Before the Print
Cancel-side asymmetry, refresh-latency p95 widening, VPIN elevation, multi-level LOB shift, spread widening, then the print. Each signal has a name, a plugin, and a GIF. Here is the full cascade as VisualHFT instruments it in real time.
Getting Started with the Open-Source VisualHFT Application
Build the open-source VisualHFT application, connect public market data, inspect its studies, and extend it with the public SDK templates.