Getting Started with VisualHFT: Real-Time Market Microstructure Analysis in 10 Minutes
I built VisualHFT after watching trading desks operate with sophisticated execution systems and zero visibility into what was happening inside the book. P&L data, latency dashboards, fill rates — all present. The one thing missing: any instrument that could tell you why the fills were getting worse, whether the venue was under liquidity stress, or whether the order flow you were seeing was informed.
VPIN, LOB imbalance, order book resilience, order-to-trade ratios — these are not academic curiosities. Easley, López de Prado, and O’Hara demonstrated in their 2012 Review of Financial Studies paper that Volume-Synchronized Probability of Informed Trading is “significantly correlated with future short-term return volatility.” Gould et al. (2013) showed that queue imbalance at the top of the book is a documented short-horizon price predictor with a half-life measured in seconds. The OFR Working Paper 2014-09 documented that the order book typically recovers from liquidity shocks within approximately 20 best-quote updates. MiFID II RTS 9 mandates monitoring of order-to-trade ratios because regulators recognized what traders already knew: high OTT is a real-time fingerprint of algorithmic probing and layering behavior.
The research existed. The commercial tools to surface these signals in real time cost between $3,600 and $27,660 per seat per year — and most of them still deliver VPIN as a black box. For practitioners who needed programmatic access and full auditability, there was nothing purpose-built.
VisualHFT is that tool. It runs in 10 minutes. It is Apache 2.0. And every calculation is inspectable against the original academic definitions.
Table of Contents
- What Market Microstructure Analysis Actually Costs
- What VisualHFT Shows You — The Built-In Studies (VPIN, LOB Imbalance, Market Resilience, OTT Ratio, Time & Sales)
- Installation and First Data Stream
- Level 2 — Extending Analytics with the Study SDK
- Level 3 — Connecting Your Own Venue with the Connector SDK
- What 1,000+ GitHub Stars Signals
- Quick-Start Checklist
What Market Microstructure Analysis Actually Costs — and Why Most Desks Skip It
A Bloomberg Terminal seat runs $27,660 per year. Refinitiv Eikon ranges from $3,600 to $22,000 per year depending on the data package. For a team of five analysts, that is a six-figure annual line item before you have written a single line of analysis code.
Retail-grade order flow tools occupy the other end of the spectrum. Sierra Chart, Quantower, Jigsaw Trading — these range from $39 to $148 per month. They offer order book visualization that works for discretionary traders. What they do not offer is a programmatic SDK for building custom microstructure analytics, multi-venue normalized data streams, or the ability to inspect and modify how each metric is calculated. You get what the vendor decided to show you. If you want to extend the analysis, you are out of options.
The gap between “black-box institutional terminal” and “retail chart tool” is where most quantitative practitioners and trading technologists operate. They have the research literacy to interpret VPIN. They have the engineering capacity to build custom studies. What they have lacked is an open, extensible platform that combines real-time limit order book visualization with a proper plugin architecture.
VisualHFT closes that gap. Over 1,000 GitHub stars and 200+ forks. Eight exchange connectors shipping out of the box. Apache 2.0 — fully commercial-safe, no copyleft obligations, no licensing friction if you deploy it in a production environment. And the only open-source desktop application that combines real-time LOB visualization with a plugin SDK for both custom analytics and custom venue connectors.
The community explicitly identified the need for a structured getting-started guide (GitHub Issue #3). This article is that guide.
What VisualHFT Shows You — The Built-In Microstructure Studies
The first time you open VisualHFT against a live data stream, you will see the limit order book as it actually is: 10 or more depth levels per side, updating in real time, with the microstructure study panels running alongside.

Here is what each study is measuring and why it matters.
VPIN — Volume-Synchronized Probability of Informed Trading
Easley, López de Prado, and O’Hara (2012) published VPIN in the Review of Financial Studies, Vol. 25, No. 5. The core finding: VPIN is “significantly correlated with future short-term return volatility.” The mechanism is straightforward — by classifying trade volume as buyer-initiated or seller-initiated across fixed volume buckets (rather than fixed time intervals), VPIN produces a real-time estimate of order flow toxicity. When VPIN rises, the probability that counterparties are informed increases. Adverse selection risk rises with it.
Frame this correctly: VPIN is a flow toxicity monitor, not a crash predictor. Its specific predictive power for the 2010 Flash Crash was challenged in subsequent literature. What it reliably does is flag regimes where the composition of order flow has shifted toward informed traders — a signal that market makers widen spreads and execution algorithms should adapt their aggression.
In VisualHFT, VPIN runs continuously against the live trade stream. Every calculation is in the source code. If you disagree with an implementation detail, you can change it.
LOB Imbalance
Gould et al. (2013), Quantitative Finance, Vol. 13(11) — limit order books “match buyers and sellers in more than half of the world’s financial markets.” Queue imbalance at the top of the book is a documented short-horizon price predictor. The half-life of this signal: seconds to under a minute.
The practical application is execution timing. When bid-side volume significantly exceeds ask-side volume at the best quotes, the short-term price pressure is upward. Execution algorithms that are aware of this imbalance can time order entry to reduce adverse fill selection. VisualHFT displays imbalance across all 10+ depth levels per side — not just the best quote — giving you the full picture of where the pressure is concentrated.
Market Resilience
OFR Working Paper 2014-09 documented that the order book typically recovers from liquidity shocks within approximately 20 best-quote updates. Market resilience in VisualHFT measures the speed of that recovery in real time. After a large aggressive order consumes book depth, how quickly does the passive side replenish?
For execution algorithms, this matters at the moment of entry. A desk executing a large order in tranches needs to know whether the book is recovering between fills or whether each tranche is executing into a progressively thinner market. Resilience tells you which regime you are in.
OTT Ratio — Order-to-Trade Ratio
MiFID II RTS 9 mandates that trading venues monitor order-to-trade ratios. The regulatory rationale is direct: high OTT reveals algorithmic probing, layering, and spoofing patterns. A participant placing 500 orders and executing 3 trades is not providing liquidity. They are mapping the book.
VisualHFT surfaces OTT in real time per symbol. Beyond its use as a regulatory monitoring instrument, it is an execution intelligence signal. When OTT spikes on a venue, the probability of interacting with manipulative order flow increases. Desks with OTT visibility can route away or adjust their execution strategy before the adverse selection materializes in the fills.

Time & Sales
Beyond the microstructure studies, VisualHFT includes a real-time Time & Sales panel — the trade-by-trade tape that shows every execution as it happens. Each trade is displayed with timestamp, price, size, and aggressor side. For practitioners who need to correlate microstructure signals with the actual trade flow, the tape is the ground truth.
VisualHFT includes additional built-in studies beyond the ones described above — all inspectable, modifiable, and verifiable against their academic definitions in the repository.
Installation and First Data Stream — From Clone to Live LOB in Under 10 Minutes
This section walks through the actual setup. No hand-waving. If you follow these steps exactly, you will have live order book data streaming in under 10 minutes.
Prerequisites
VisualHFT targets .NET 8.0 and runs as a WPF desktop application on Windows. You need:
- .NET 8.0 SDK — download from dotnet.microsoft.com. Verify installation:
dotnet --version
# Should return 8.0.x-
Visual Studio 2022 Community (free) — download from visualstudio.microsoft.com. During installation, select the .NET desktop development workload. This pulls in WPF support and the build toolchain.
-
SQL Server (optional) — VisualHFT includes SQL scripts for position tracking and execution logging. If you only want real-time visualization without historical persistence, skip this. The core LOB and study panels work without a database.
Step 1: Clone and Open
git clone https://github.com/visualHFT/VisualHFT.git
cd VisualHFT
Open VisualHFT_L3.sln in Visual Studio. The solution contains the core application, the commons libraries (VisualHFT.Commons, VisualHFT.Commons.WPF), and all plugin projects — exchange connectors and study plugins compiled together.
Step 2: Build
Press Ctrl+Shift+B or Build → Build Solution. The solution compiles the core app, eight exchange connectors, and all study plugins in one pass. NuGet restore runs automatically and pulls dependencies including:
Binance.Net,Bitfinex.Net,Kraken.Net(exchange client libraries via CryptoExchange.Net)OxyPlot(charting)log4net(logging)Newtonsoft.Json(serialization)PropertyChanged.Fody(MVVM property change notifications)
If the build fails, the most common cause is a missing .NET 8.0 SDK or the wrong Visual Studio workload. Verify with dotnet --list-sdks and confirm a 8.0.x entry exists.
Step 3: Run and Configure Your Exchange
Press F5. The application launches and presents a connector selection screen. Eight connectors ship out of the box:
| Connector | Exchange | API Key Required? |
|---|---|---|
| Binance | Binance Spot | No (public market data) |
| Bitfinex | Bitfinex | No (public market data) |
| BitStamp | Bitstamp | No (public market data) |
| Coinbase | Coinbase Advanced | No (public market data) |
| Gemini | Gemini | No (public market data) |
| Kraken | Kraken Spot | No (public market data) |
| KuCoin | KuCoin | No (public market data) |
| Generic WebSocket | Any venue | Depends on venue |
For public order book data, no API key is required. Select Binance or Kraken for the fastest setup — these connectors are the most battle-tested.
Each connector exposes configuration properties including Symbols (which instruments to subscribe), DepthLevels (how many book levels to request), and AggregationLevelMs (how often to batch updates). The defaults work for a first run.
Step 4: Select a Symbol and Go Live
Enter a symbol in normalized format — for example, BTC-USD. The normalization layer handles exchange-specific ticker variations (Binance’s BTCUSDT, Kraken’s XXBTZUSD, etc.) transparently.
The LOB populates immediately. Trade stream activates. Within seconds you have:
- 10+ depth levels per side updating in real time
- VPIN calculating against the live trade stream
- LOB Imbalance across all visible depth levels
- Market Resilience measuring recovery speed after aggressive orders
- OTT Ratio tracking order-to-trade patterns per symbol
Total time from git clone to live data: under 10 minutes with .NET 8.0 already installed. Under 20 minutes including SDK installation.
Troubleshooting
Build fails with “target framework not found” — You need the .NET 8.0 SDK, not .NET 7.0 or 6.0. The project targets net8.0-windows. Run dotnet --list-sdks to verify.
WebSocket connection drops or no data — Check your firewall. The connectors use outbound WebSocket connections (WSS on port 443). Some corporate networks block WebSocket traffic.
Studies show “N/A” or zero values — Studies need a minimum data volume before calculations produce meaningful output. VPIN requires enough trades to fill at least one volume bucket. Give it 30-60 seconds of live data.
Level 2 — Extending Analytics with the Study SDK
Once you have live data streaming, the next step is building your own microstructure analytics. VisualHFT provides a Study SDK with a complete template at SDK-StudyTemplate/ in the repository root.
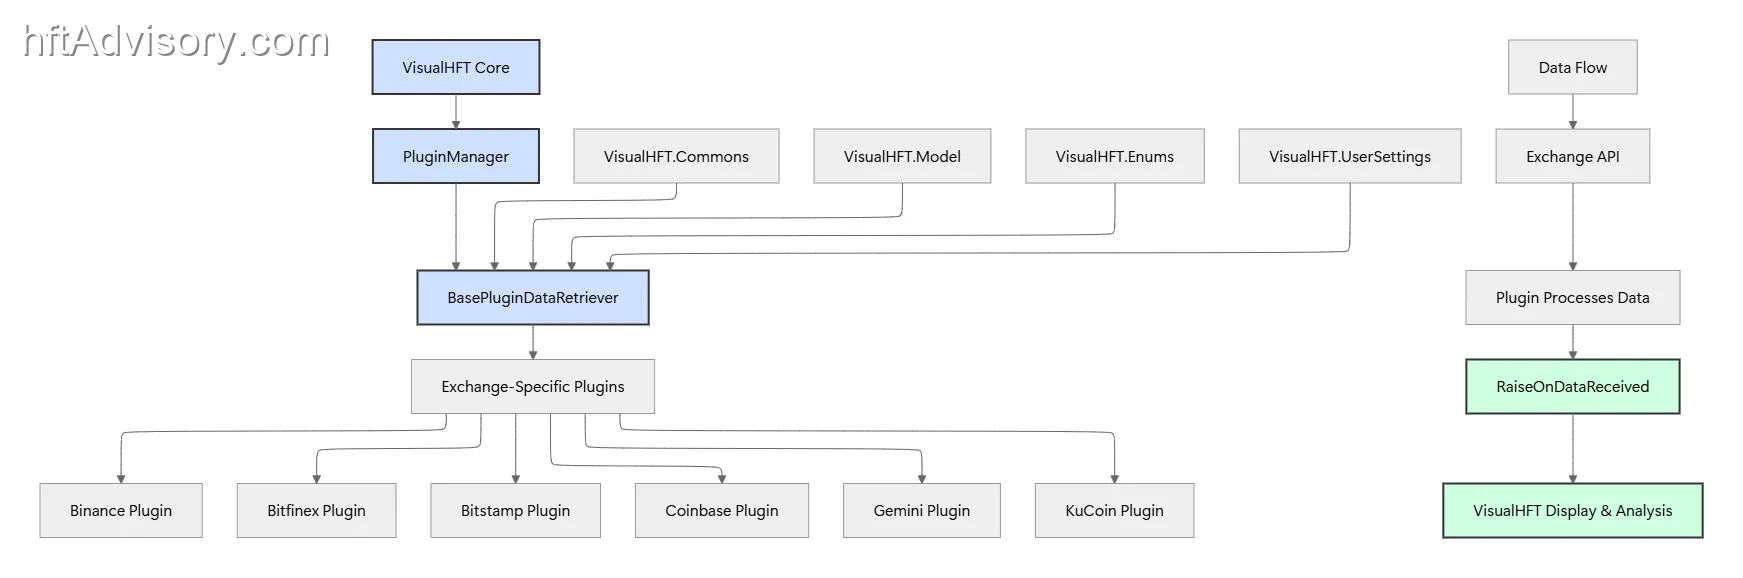
The Architecture
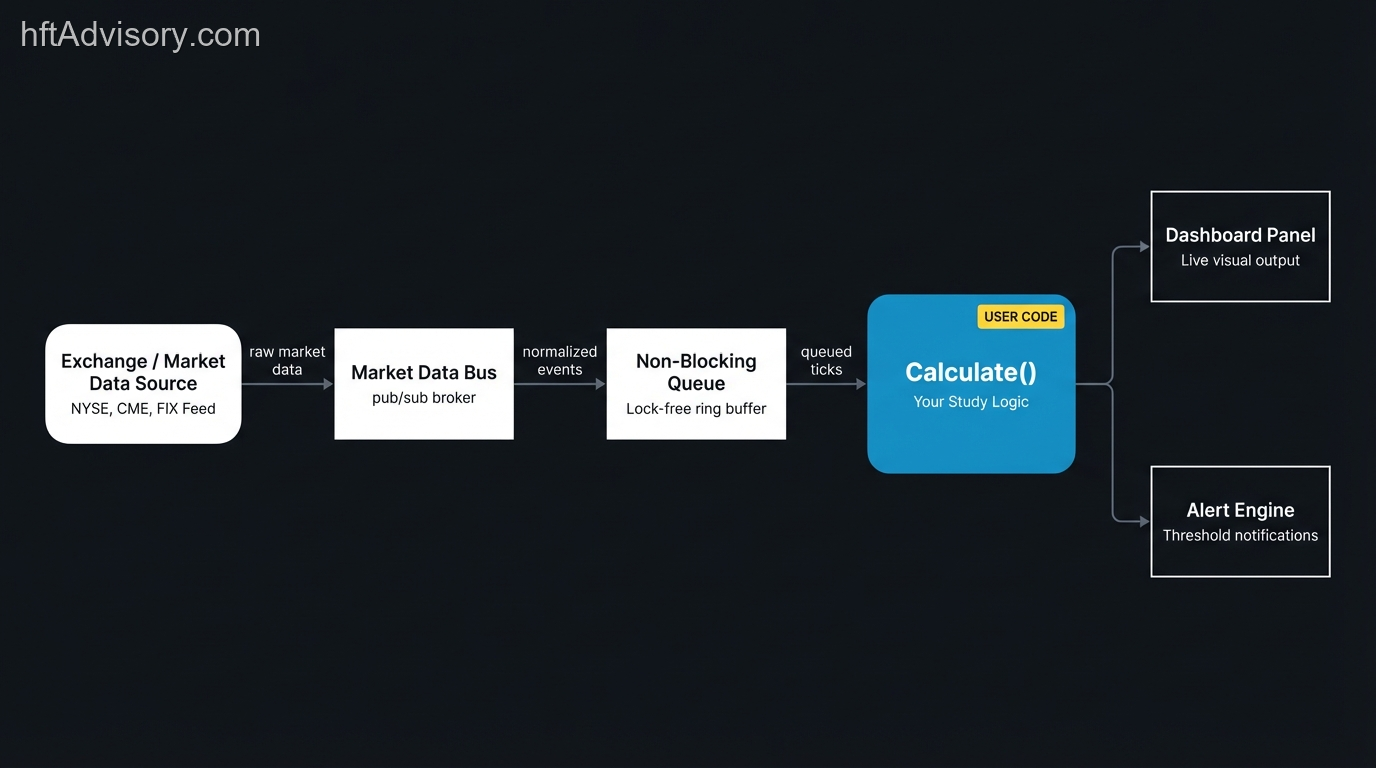
Every study plugin inherits from BasePluginStudy and follows this data flow:
Market Data → OnOrderBookDataReceived() → Queue → Calculate() → OnCalculated Event → DashboardThe queue architecture is the critical design decision. Market data arrives at microsecond-scale frequency. Your calculation logic runs on a separate thread, reading from the queue at its own pace. This non-blocking pattern — the same architecture that delivered a 40% throughput improvement in the March 2025 release — means your calculation never blocks the data feed, and the data feed never waits for your calculation.
Building Your First Custom Study
Step 1: Copy the template. Duplicate the SDK-StudyTemplate/ folder. Rename it to match your study — for example, Studies.SpreadTracker.
Step 2: Implement your calculation. The template gives you four files to work with:
TemplateStudyPlugin.cs— Your main plugin class. This is whereCalculate()lives.PlugInSettings.cs— Configuration parameters (thresholds, window sizes, etc.)PluginSettingsViewModel.cs— MVVM view model for the settings UIPluginSettingsView.xaml— WPF interface for configuring your study at runtime
The core pattern is queue-based: subscribe to order book events, enqueue snapshots, process calculations asynchronously. This is critical — you must never block the data callback. The OrderBookSnapshot is a zero-copy struct containing the full book state with bids, asks, mid price, spread, and min/max sizes.
public class SpreadTrackerStudy : BasePluginStudy
{
    private HelperCustomQueue<OrderBookSnapshot> _QUEUE;
    private PlugInSettings _settings;

    public override async Task StartAsync()
    {
        await base.StartAsync();
        // Subscribe to the order book event bus
        HelperOrderBook.Instance.Subscribe(OnOrderBookDataReceived);
    }

    // CRITICAL: Do NOT block this callback. Enqueue and return.
    private void OnOrderBookDataReceived(OrderBook orderBook)
    {
        if (orderBook == null) return;
        if (_settings.Provider.ProviderID != orderBook.ProviderID
            || _settings.Symbol != orderBook.Symbol) return;

        var snapshot = OrderBookSnapshot.Create();
        snapshot.UpdateFrom(orderBook);  // zero-copy via Span<T>
        _QUEUE.Add(snapshot);
    }

    // Queue handler — your calculation logic goes here
    private void QUEUE_onRead(OrderBookSnapshot snapshot)
    {
        double spread = snapshot.Spread;
        double mid = snapshot.MidPrice;

        if (mid > 0)
        {
            double spreadBps = (spread / mid) * 10000;
            var result = new BaseStudyModel();
            result.Value = (decimal)spreadBps;
            result.Timestamp = HelperTimeProvider.Now;
            AddCalculation(result);  // publishes to dashboard
        }
        snapshot.Dispose();  // MUST dispose — returns pooled arrays
    }
}
Step 3: Configure alerts. The framework includes alert delivery. When your calculated value crosses a threshold you define in PlugInSettings, the alert fires automatically. You define the threshold; the plumbing is built.
Step 4: Build and deploy. Compile the project. Copy the output DLL to the plugins/ folder. Restart VisualHFT. Your study appears in the dashboard alongside the built-in VPIN, LOB Imbalance, Market Resilience, and OTT Ratio panels.
Reference Implementations Worth Reading
Before writing your first custom study, read the built-in implementations in the VisualHFT.Plugins/ directory:
- VPIN — Volume bucket classification, rolling window aggregation
- LOBImbalance — Multi-level depth ratio calculation
- MarketResilience — Recovery speed measurement after aggressive orders
- OTT_Ratio — Order count vs. trade count tracking
Each one is a working reference implementation of an academically-grounded microstructure calculation. The template also includes simpler examples — moving averages, RSI, spread — which demonstrate the patterns without the academic complexity.
Level 3 — Connecting Your Own Venue with the Market Connector SDK
For trading technology teams that need to connect a venue not included in the eight default connectors, VisualHFT provides a Market Connector SDK at SDK-MarketConnectorTemplate/ in the repository root.
What the Template Gives You
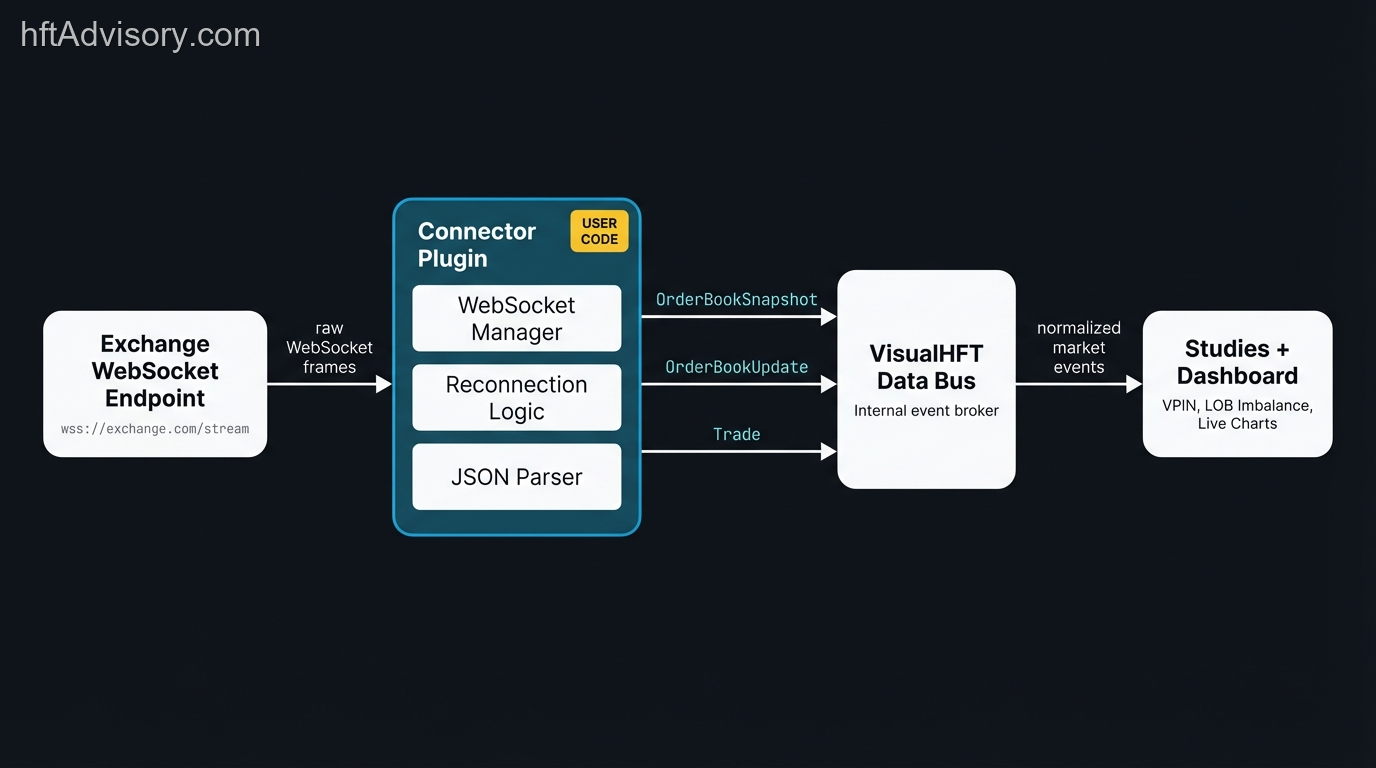
The template handles the infrastructure that is identical across connectors: WebSocket connection management, reconnection logic with exponential backoff, JSON message parsing, and the data bus integration. What you implement is the venue-specific layer.
The template includes two core files:
TemplateExchangePlugin.cs— Your main connector class inheriting fromBasePluginDataRetrieverJsonParser.cs— Message deserialization for your exchange’s specific format
Your connector class inherits from BasePluginDataRetriever and pushes normalized data to VisualHFT’s event bus:
public class MyExchangePlugin : BasePluginDataRetriever
{
    private MyExchangeSettings _settings;

    public MyExchangePlugin()
    {
        // Register reconnection handler (exponential backoff built-in)
        SetReconnectionAction(InternalStartAsync);
    }

    public override async Task StartAsync()
    {
        await base.StartAsync();
        await InternalStartAsync();
        // Notify VisualHFT that the connector is live
        RaiseOnDataReceived(GetProviderModel(eSESSIONSTATUS.CONNECTED));
    }

    private async Task InternalStartAsync()
    {
        foreach (string symbol in GetAllNormalizedSymbols())
        {
            // Subscribe to your exchange's WebSocket feed here
        }
    }

    // When your exchange sends an order book update:
    private void OnOrderBookUpdate(ExchangeBookData update)
    {
        var orderBook = new OrderBook { /* map fields */ };
        RaiseOnDataReceived(orderBook);  // pushes to VisualHFT
    }

    // When your exchange sends a trade:
    private void OnTradeUpdate(ExchangeTradeData update)
    {
        var trade = new Trade { /* map fields */ };
        RaiseOnDataReceived(trade);
    }
}
The base class provides reconnection with exponential backoff (up to 5 retries), symbol normalization helpers (GetNormalizedSymbol(), GetAllNonNormalizedSymbols()), and decimal place auto-detection. Configuration properties including ApiKey, ApiSecret, Symbols, DepthLevels, and AggregationLevelMs are exposed through a settings UI. For public market data feeds, most exchanges require no API key.
The Normalized Message Format
The SDK includes sample JSON files in SampleMessages/ showing exactly what VisualHFT expects. Here is the order book update format:
{
  "type": "orderbook",
  "symbol": "BTC-USD",
  "timestamp": 1703980801000,
  "sequence": 123456790,
  "isSnapshot": false,
  "bids": [
    [43250.75, 1.5432],
    [43249.00, 0.0000]
  ],
  "asks": [
    [43251.50, 0.0000],
    [43252.25, 1.9876]
  ]
}
Each entry is a [price, size] pair. A size of 0.0000 means that level has been removed. The isSnapshot flag distinguishes full book state from incremental deltas. The sequence field enables gap detection — if you miss a sequence number, request a fresh snapshot.
The SDK includes sample messages for all three event types: OrderBookSnapshot.json, OrderBookUpdate.json, and Trade.json, plus Error.json and Subscription.json for connection management.
Reference Implementations
Before writing a connector for a new venue, read the Binance connector (VisualHFT.Plugins/MarketConnectors.Binance/BinancePlugin.cs). It uses the Binance.Net client library and covers the common patterns: snapshot-then-delta sequencing, sequence number validation, and handling reconnection without losing book state. The Kraken connector follows the same pattern with Kraken-specific message formats.
If your target venue follows a standard WebSocket protocol (which most do), the Binance connector is 80% of what you need. Deploy is the same as the Study SDK: build DLL, drop in plugins/ folder, restart. Your new connector appears in the exchange selector.
The practical scope: any WebSocket-capable venue can be connected. The architecture is not exchange-specific. I have seen teams connect internal matching engines in a matter of hours using this template.
What 1,000+ GitHub Stars Signals — and What It Means for Your Desk
GitHub stars are a weak signal in isolation. Forks are a stronger one. Over 200 teams have taken the VisualHFT codebase and adapted it for their own environments. That is institutional adoption behavior — not casual interest. Developers star repositories they find interesting. They fork repositories they intend to use.
The Apache 2.0 license means there are no constraints on how you deploy it. Run it in a live production monitoring environment. Fork it, modify it, keep your changes proprietary. No copyleft obligations, no licensing conversations with vendors, no audit risk if your legal team reviews the dependency.
Every calculation in VisualHFT is auditable. When Bloomberg shows you VPIN on a terminal, the implementation is a black box. When VisualHFT shows you VPIN, the implementation is 500+ commits of C# code you can read, modify, and verify against the original Easley, López de Prado, O’Hara (2012) paper. For desks that operate under regulatory scrutiny or internal model validation requirements, that auditability has material value.
The most recent release (March 2025) delivered a 40% throughput improvement through a custom queue implementation — the same pattern that underpins the Study SDK’s non-blocking calculation architecture. Active development on a project with this star count and fork count indicates a project that has reached the inflection point where community maintenance becomes self-sustaining.
VisualHFT Quick-Start Checklist
Bookmark this. Come back to it when you are setting up a new environment or onboarding a team member.
Environment Setup:
- Install .NET 8.0 SDK — verify with
dotnet --version(must return8.0.x) - Install Visual Studio 2022 Community with .NET desktop development workload
- Clone:
git clone https://github.com/visualHFT/VisualHFT.git - Open
VisualHFT_L3.sln→ Build Solution (Ctrl+Shift+B) — all plugins compile in one pass - If build fails: run
dotnet --list-sdksand confirm8.0.xis present
First Run:
- Press
F5→ select Binance or Kraken connector (no API key needed for public data) - Enter symbol in normalized format:
BTC-USD - Verify study panels activate: VPIN, LOB Imbalance, Market Resilience, OTT Ratio
- Wait 30-60 seconds for sufficient data volume before evaluating study output
Custom Study (Level 2):
- Copy
SDK-StudyTemplate/folder → rename to your study name - Inherit from
BasePluginStudy→ subscribe toHelperOrderBook.Instance, implement queue handler withAddCalculation() - Build DLL → copy to
plugins/folder → restart VisualHFT - Reference: read the VPIN and LOBImbalance implementations first
Custom Connector (Level 3):
- Copy
SDK-MarketConnectorTemplate/folder → rename to your venue - Inherit from
BasePluginDataRetriever→ parse exchange data and callRaiseOnDataReceived() - Map your exchange’s messages to the normalized JSON format (see
SampleMessages/) - Build DLL → copy to
plugins/folder → restart VisualHFT - Reference: read the Binance connector implementation first
Final:
- Star the repository: https://github.com/visualHFT/VisualHFT
The Standard for Microstructure Observability
The question worth asking your team: can your desk see VPIN, LOB Imbalance, Market Resilience, and Order-to-Trade Ratio in real time — without vendor lock-in, without a six-figure terminal cost per seat, and without waiting for an engineering sprint to extend the analytics to a new venue or a new study?
VisualHFT is open source and running in 10 minutes. Every study is inspectable. Every calculation is modifiable. The connector architecture reaches any WebSocket venue. The license is Apache 2.0.
If your current monitoring stack cannot match that baseline, the gap is worth understanding before you write the next check to a terminal vendor.
Star the repo on GitHub. The community is already at 1,000+ — and growing.
https://github.com/visualHFT/VisualHFT
Ariel Silahian is the creator of VisualHFT and has spent 20+ years in high-frequency trading infrastructure. He is a published author (Packt) and the creator of VisualHFT, an open-source market microstructure analysis platform with 1,000+ GitHub stars.