A Stale Feed Looks Exactly Like a Calm Market: Monitoring Trading Infrastructure in Real Time
A market-data feed that stops does not raise an error.
Every number downstream of it, your book, your signals, your risk, is computed from messages that arrived. When messages stop arriving, those numbers do not go wrong. They go stale, and a stale number looks exactly like a calm market. Nothing throws. Nothing turns red. The dashboard shows a quiet book, and quiet books are common.
That is the defining property of trading-infrastructure failure: it almost never announces itself as an infrastructure failure. It arrives disguised as a market observation, and the instinctive read is the wrong one.
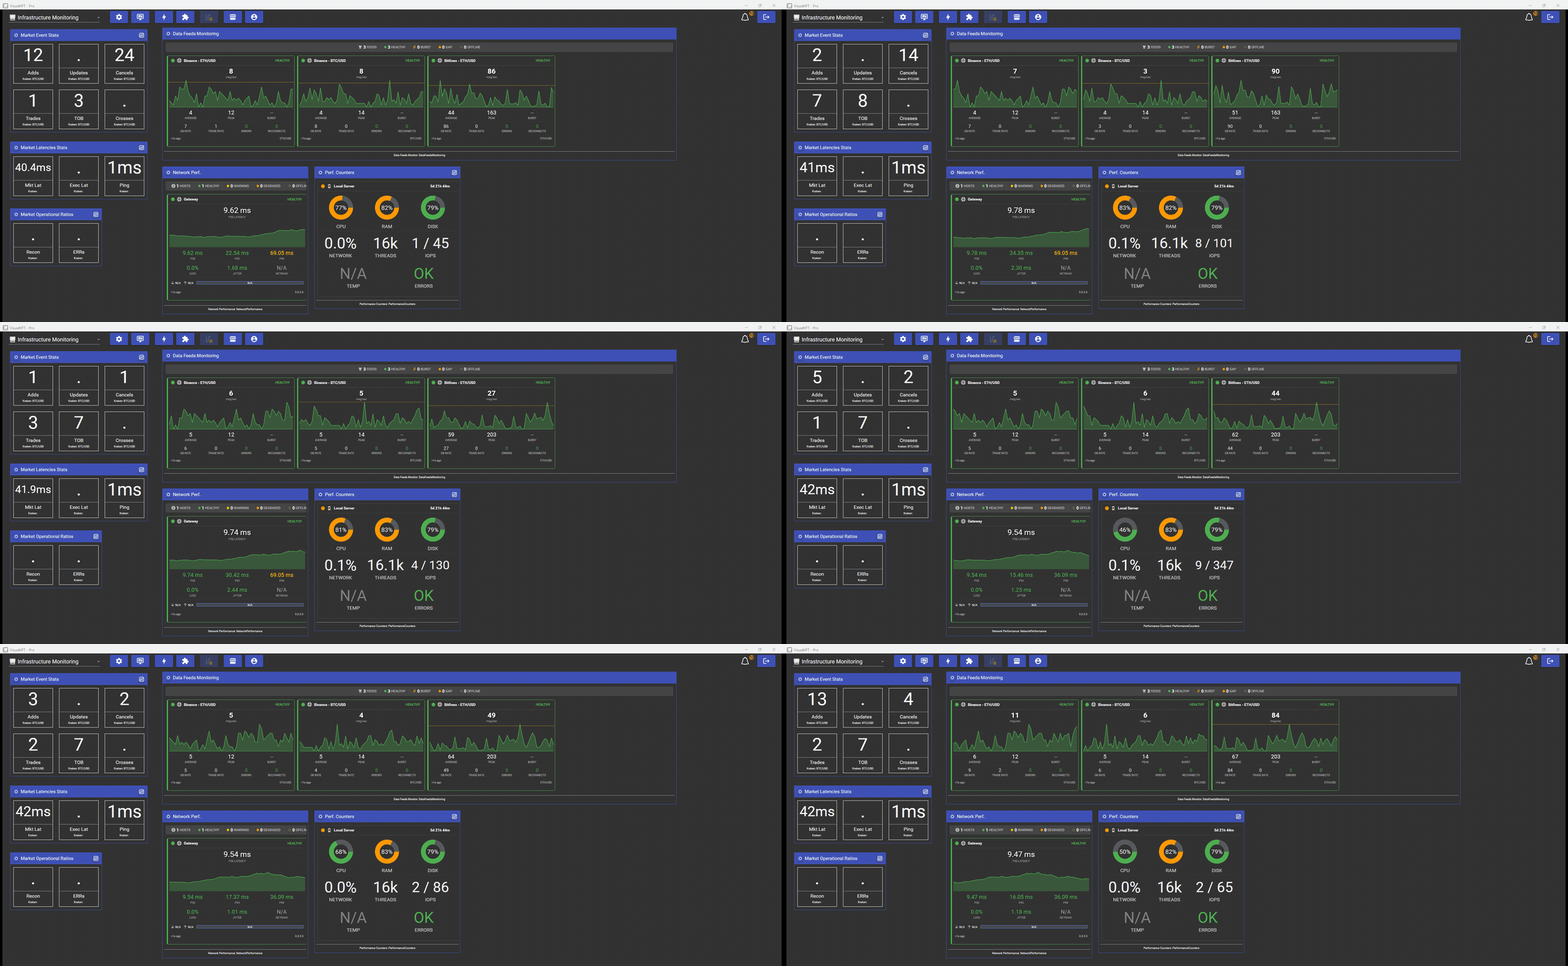
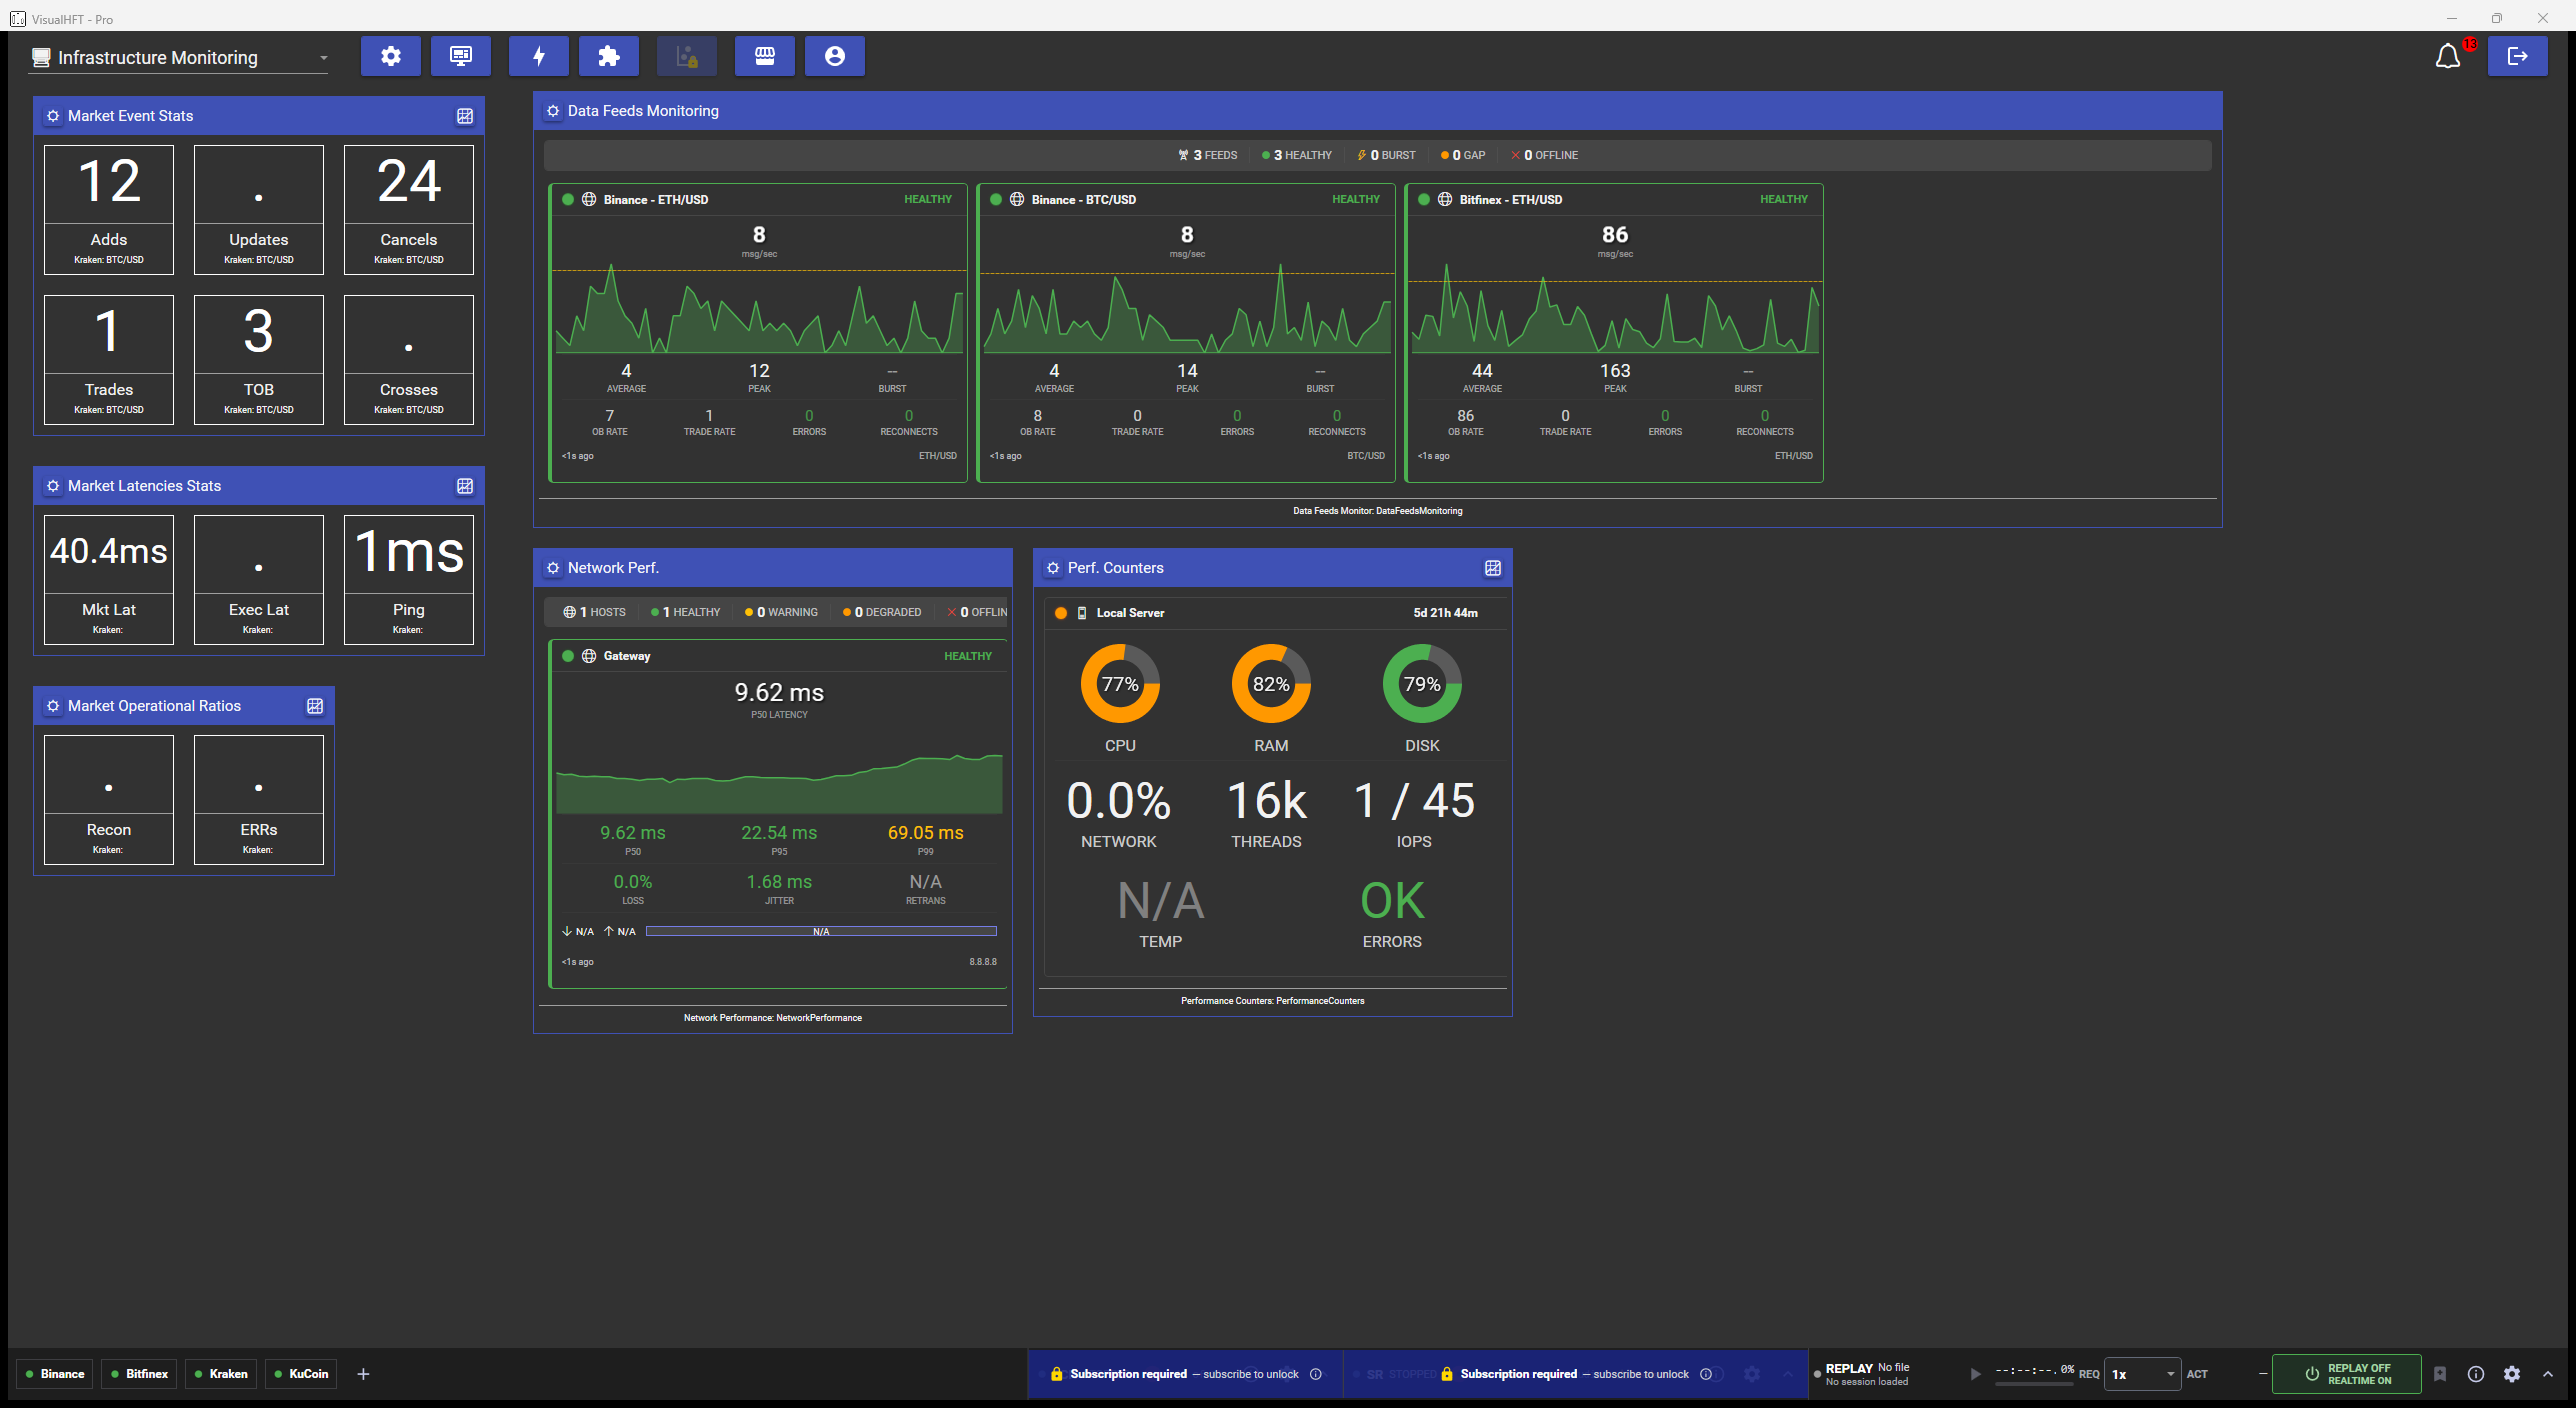
Six monitoring plugins on one screen, live: feed health per watched pair, network path quality, host counters, and the exchange-side latency and event counters.
Four failures that wear a disguise
The quiet book that is not quiet. The feed slows and then stops. There is no exception to catch, because a socket that delivers nothing is not an error condition, it is just a socket delivering nothing. Meanwhile every study you run keeps computing on the last messages it received. If nobody is measuring inter-message silence, the first person to notice is usually the one asking why the last hour of fills does not match the book they were watching.
The latency with two suspects. A venue starts looking slow. Feed rates sag, the book ages. The problem is that a venue publishing late and a network path degrading produce the same symptom on every consumer you have, and the two have completely different responses: one is a venue problem you report, the other is a network problem you fix. Without a measurement that separates them, the argument about which one it is takes longer than either fix.
The book that is wrong rather than slow. A dropped delta, a frame applied out of order, a resync that never finished. The book in memory stops being a faithful picture of the venue, and everything computed from it is now confidently wrong rather than stale. The tell is momentary impossibility, a best bid above a best ask, and it is invisible unless something is counting exactly that.
The overnight host failure. Memory creeping up, a disk quietly filling, a CPU pinned by something that is not you. These are slow, monotonic, and completely visible hours before they become an outage. They are also the failures most often diagnosed in the morning as “the venue was slow last night,” because host symptoms surface first as latency.
The common thread: in every case the infrastructure question and the market question share a symptom. The job of infrastructure monitoring on a trading desk is not to collect metrics. It is to separate those two questions fast.
The useful split: which side of the wire
The first triage question is not what broke. It is which side of the wire did it break on: the machines you run, or the venue connection you consume. Everything below follows from making that split measurable.
Measure feed liveness against a learned baseline
A raw message rate is not enough, because “normal” differs by venue, symbol, and hour. The useful signals are relative:
- A burst is the current one-second rate exceeding a multiple of a rolling baseline, an exponential moving average over a configurable window (60 seconds by default, multiplier 3.0). One detail matters more than it looks: the comparison runs against the previous average, before the current sample is folded in, so a single large tick cannot raise the baseline enough to hide itself.
- A gap is inter-message silence exceeding a threshold (5 seconds by default). The higher-value signal is the warning at half that threshold: “approaching a gap” is the earliest moment you can tell a feed is slowing down, and it arrives before the gap does. That is the state worth alerting on.
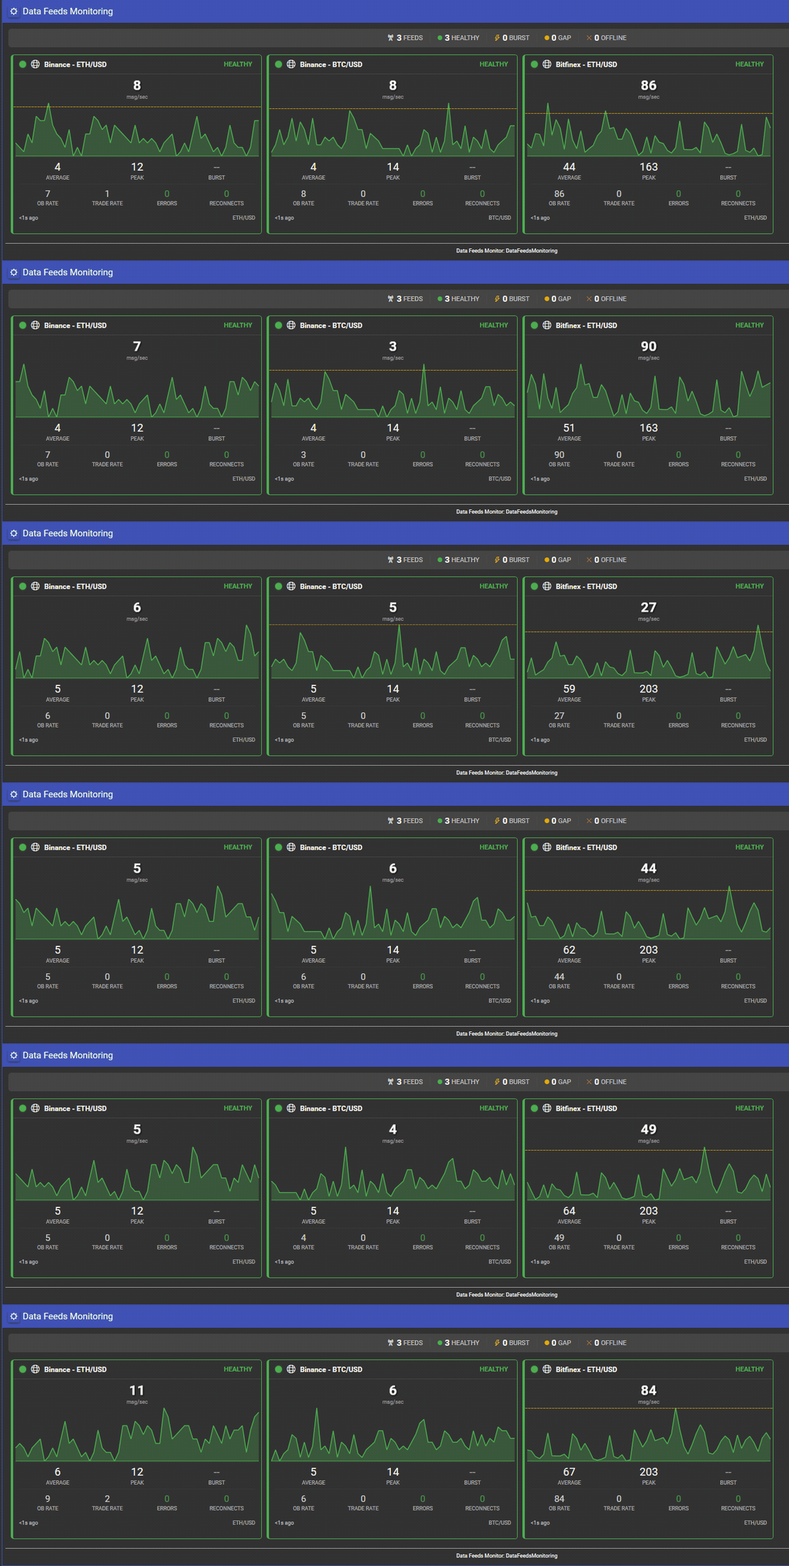
Watching feeds side by side is what makes the diagnosis fast. Every card runs on the same machine, the same link, the same process. When one venue gaps while its neighbours keep moving, you have already ruled out your host, your network, and your build. That elimination is the whole point of a fleet view.
Measure the path itself, in percentiles of real probes
When a venue looks slow, the second suspect is the route to it. The measurement that settles it is active probing of the hop that actually matters to you, your exchange gateway or your colocated box, with the arithmetic done carefully: every individual probe round trip goes into the rolling window, and P50, P95 and P99 are computed over those raw samples. A single bad round trip inside a cycle shows up in P99 instead of being averaged away before it is measured. Jitter is tracked as an RFC 3550 moving average, loss as the percentage of a cycle’s probes that never came back, and TCP retransmits are read from the far end of the link.
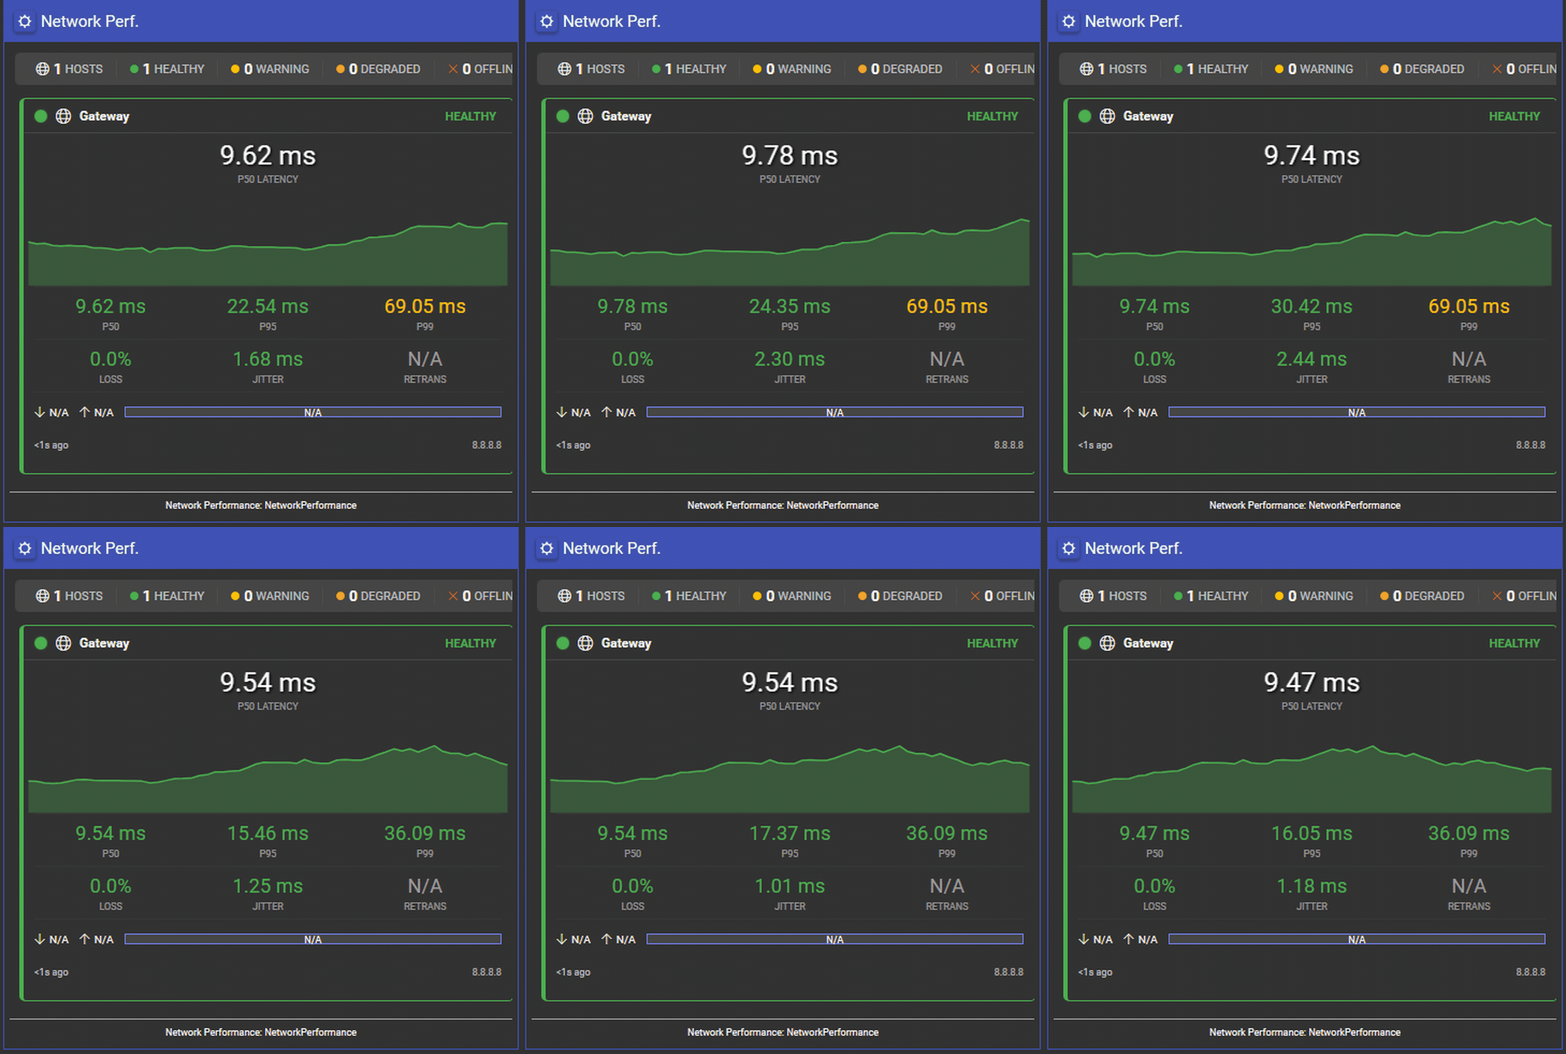
The signature to learn: P99 rising while P50 holds flat is intermittent loss, not a route shift. Check packet loss and jitter before concluding the path got longer. And loss is usually a precursor rather than an event, which is why a rule on Packet Loss crossing 1% earns its keep.
Measure latency on the venue’s clock
Everything you decide is based on a book that was true a moment ago. Market-data latency is how long ago: the age of the book in front of you, measured against the venue’s own event timestamp carried in the stream, not against anything the receiving side measures about itself. Where a venue’s feed publishes no event timestamp, no market-latency figure is produced for it at all; nothing is fabricated from the local clock. And when no new sample arrives, the counter holds its last reading rather than spiking, so a briefly static figure means “no new sample”, not a stalled feed.
Two consequences are worth internalising. The figure includes the offset between your clock and the venue’s, so two venues that are genuinely equidistant can read differently, and a venue whose clock runs ahead of yours reads a flat 1µs. That flat reading means clock skew, not “instant”. Both effects point the same way: judge market latency as a trend against that venue’s own normal range, never as an absolute to compare across venues.
Read it alongside two companions and the ambiguity collapses:
| Market latency | Ping (REST round trip) | Network P99 | Read it as |
|---|---|---|---|
| Up | Flat | Flat | The venue is publishing late. Nothing on your side to fix |
| Up | Up | Up | Your path degraded. The venue is probably fine |
| Up | Flat | P99 up, P50 flat | Intermittent loss. Check packet loss and jitter |
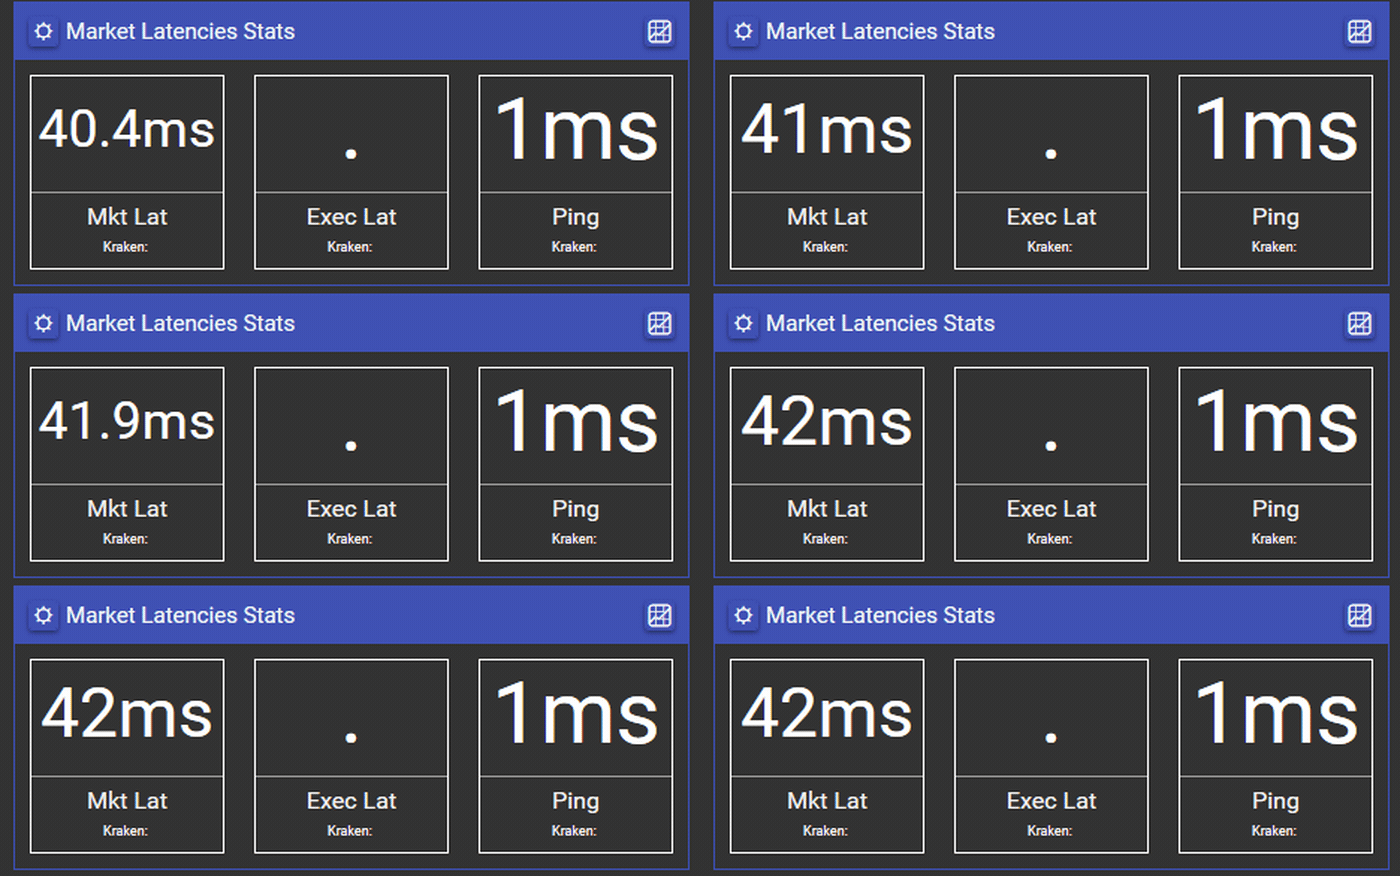
Ping deserves one caveat: it is an HTTPS round trip to the venue’s REST endpoint, a different path from the market-data socket. Ping steady while market latency climbs means the market-data side specifically is falling behind. That asymmetry is information.
Measure what kind of messages, not just how many
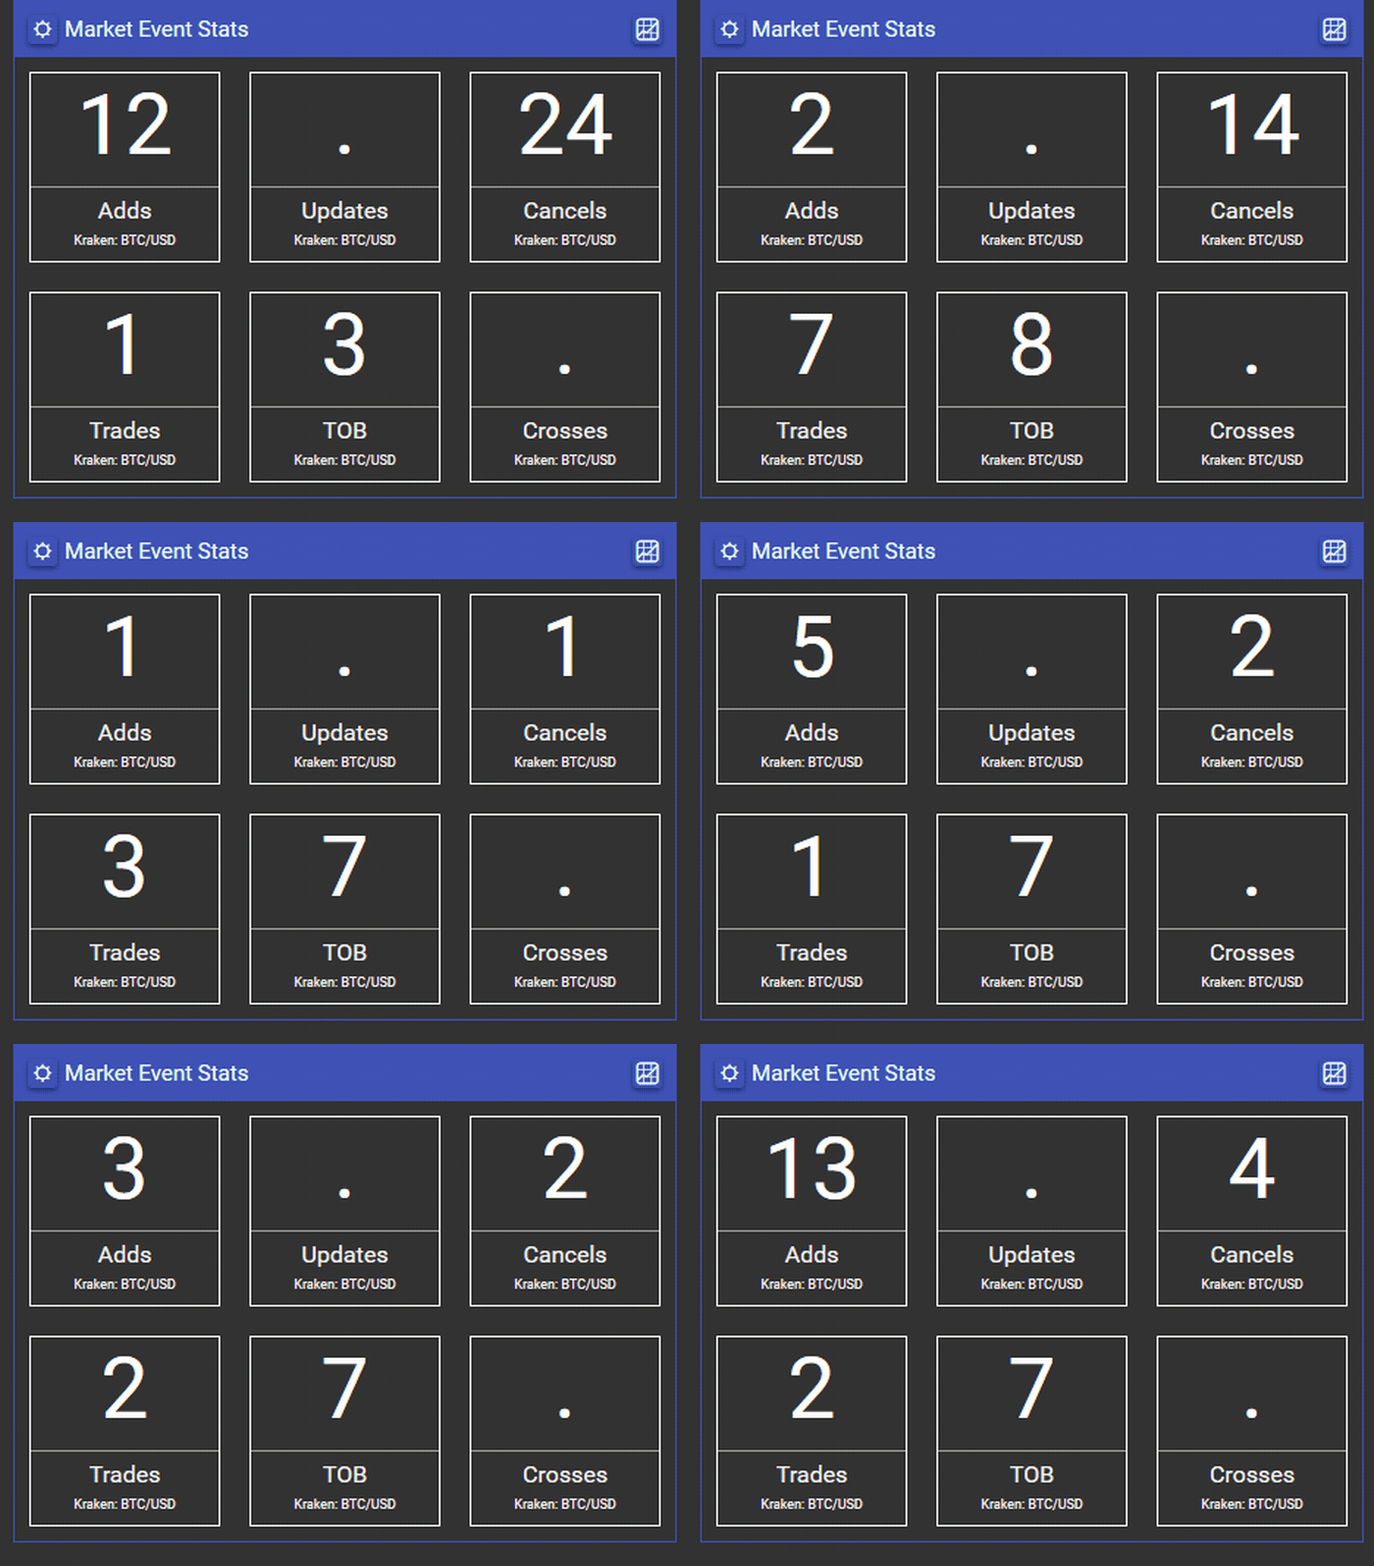
A healthy message rate can still carry a broken book. Splitting the stream by event type answers questions a raw rate cannot:
- Heavy adds and cancels with trades near zero is a market quoting at you rather than dealing with you.
- Top-of-book changes collapsing while adds and cancels hold means the churn moved away from the touch.
- A crossed book, best bid above best ask, is not a market condition you trade. On a single venue it means the book in memory is momentarily impossible: a dropped delta, an out-of-order frame, an unfinished resync. It is the one counter where any sustained reading at all is a correctness problem, which makes it the easiest alert you will ever write: greater than zero.
Watch the host with the same glance
The overnight failure is the cheapest one to prevent, precisely because it is slow. CPU, memory, disk, network, threads, IOPS and uptime per monitored server, Windows or Linux, local or remote, on the same screen as the feeds, means “is it the box?” gets ruled in or out in seconds instead of being the hypothesis you test last.
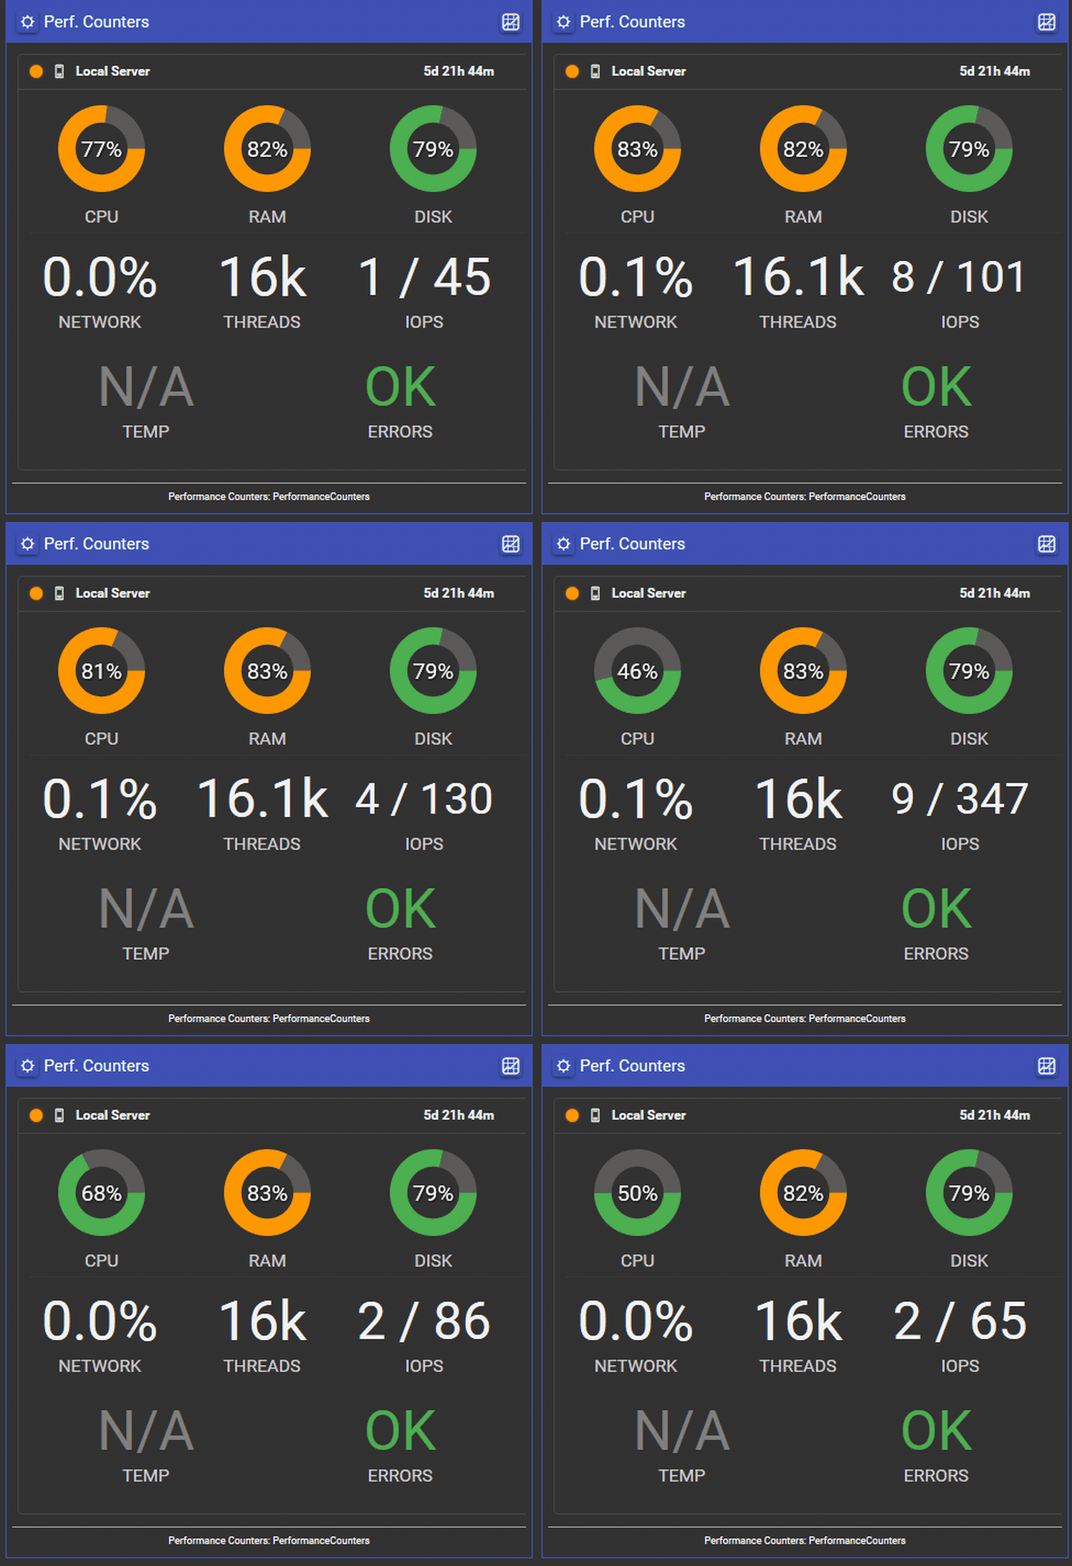
The highest-value rule on a trading host is also the least glamorous: memory usage crossing 90%, disk usage crossing 90%, wired to whatever pages you. It is the only rule that fires while you are not watching, which is exactly when this class of failure happens.
Alert on it, do not stare at it
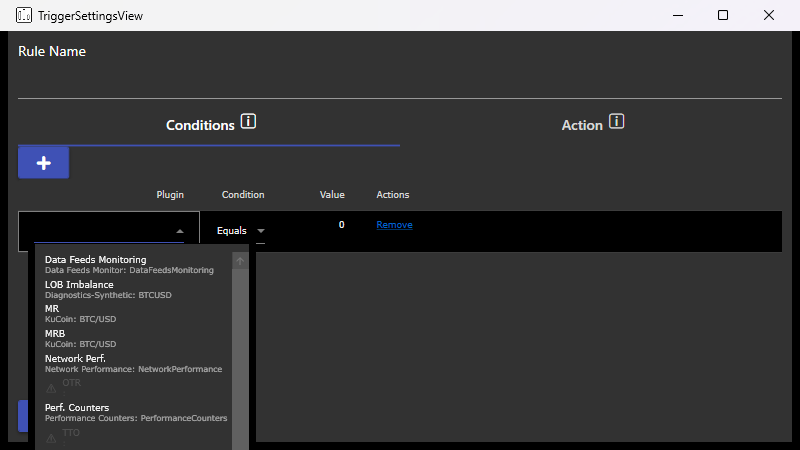
None of this works as a screen someone is supposed to keep looking at. Every measurement above needs to feed a rule engine: when a metric crosses a condition, then raise an alert or POST to an endpoint. Two features separate rules that page usefully from rules that cry wolf: a time window, so “above the line” becomes “above the line for ten seconds” and one bad probe cycle pages nobody, and a per-action cooldown, so a flapping condition does not flood the endpoint on the other side.
This is what VisualHFT ships as one dashboard
Everything above is a description of VisualHFT’s Infrastructure Monitoring dashboard: a built-in layout hosting six study plugins, included in the installer and unlocked by a Core plan. Nothing extra to buy, nothing extra to install.
| Plugin | What it watches |
|---|---|
| Data Feeds Monitoring | Per-feed message rate, burst, gap and health for many venue and symbol pairs at once |
| Network Performance Monitoring | ICMP or SSH path quality per remote host: latency percentiles, loss, jitter, retransmits, bandwidth |
| Performance Counters Remote Servers | CPU, memory, disk, network, threads, IOPS and uptime on each server you add |
| Market Event Stats | Order-book event rates: adds, updates, cancels, trades, top-of-book changes, crossed books |
| Market Latencies Stats | Market-data, execution and ping latency for a venue |
| Market Operational Ratios | Reconnections and connector errors for a venue |
Two of the six watch your machines; four watch the venue connection. That is the which-side-of-the-wire split, built into the layout.
Every metric the six plugins produce, feed gap durations, latency percentiles, host memory, crossed-book counts, is published to VisualHFT’s trigger engine, where a rule is a when (metric, operator, threshold, optional time window) and a then (in-app alert, or a REST POST whose body template substitutes placeholders — the rule name, condition, metric, value, threshold and timestamp — before it is sent). The starting rules we suggest for an infrastructure desk:
| When | Why |
|---|---|
Gap Duration Sec crosses above 5 on your primary feed | Know the moment a feed goes quiet |
Latency P99 above your critical threshold for 10 seconds | Path degradation, not a single bad probe |
Packet Loss crosses above 1 | Loss is a precursor, not an event |
Memory Usage crosses above 90 on the trading host | The classic overnight failure |
Recon greater than 0 | A venue is dropping your session |
One workflow this enables deserves its own mention: qualifying a venue before you route to it. Connect the venue, add its pairs to the feed monitor, point the counter groups at it, and watch fifteen minutes of active hours for five things: a feed card that holds healthy without touching zero, a stable market-latency spread, reconnections and errors that stay flat, a crossed-book counter that never reports, and a trade counter that is actually non-zero. A book with quotes and no prints is not a venue you have finished testing.
The full write-up lives in the documentation, with every measurement defined, the settings and their accepted ranges, per-venue coverage notes, and the diagnostic playbook for each of the situations above: