Monitor your trading infrastructure
The Infrastructure Monitoring dashboard and the six shipping plugins behind it: feed health, network path quality, remote server counters, exchange latency, operational errors, and order-book event rates. Setup, what each number measures, and how to alert on it.
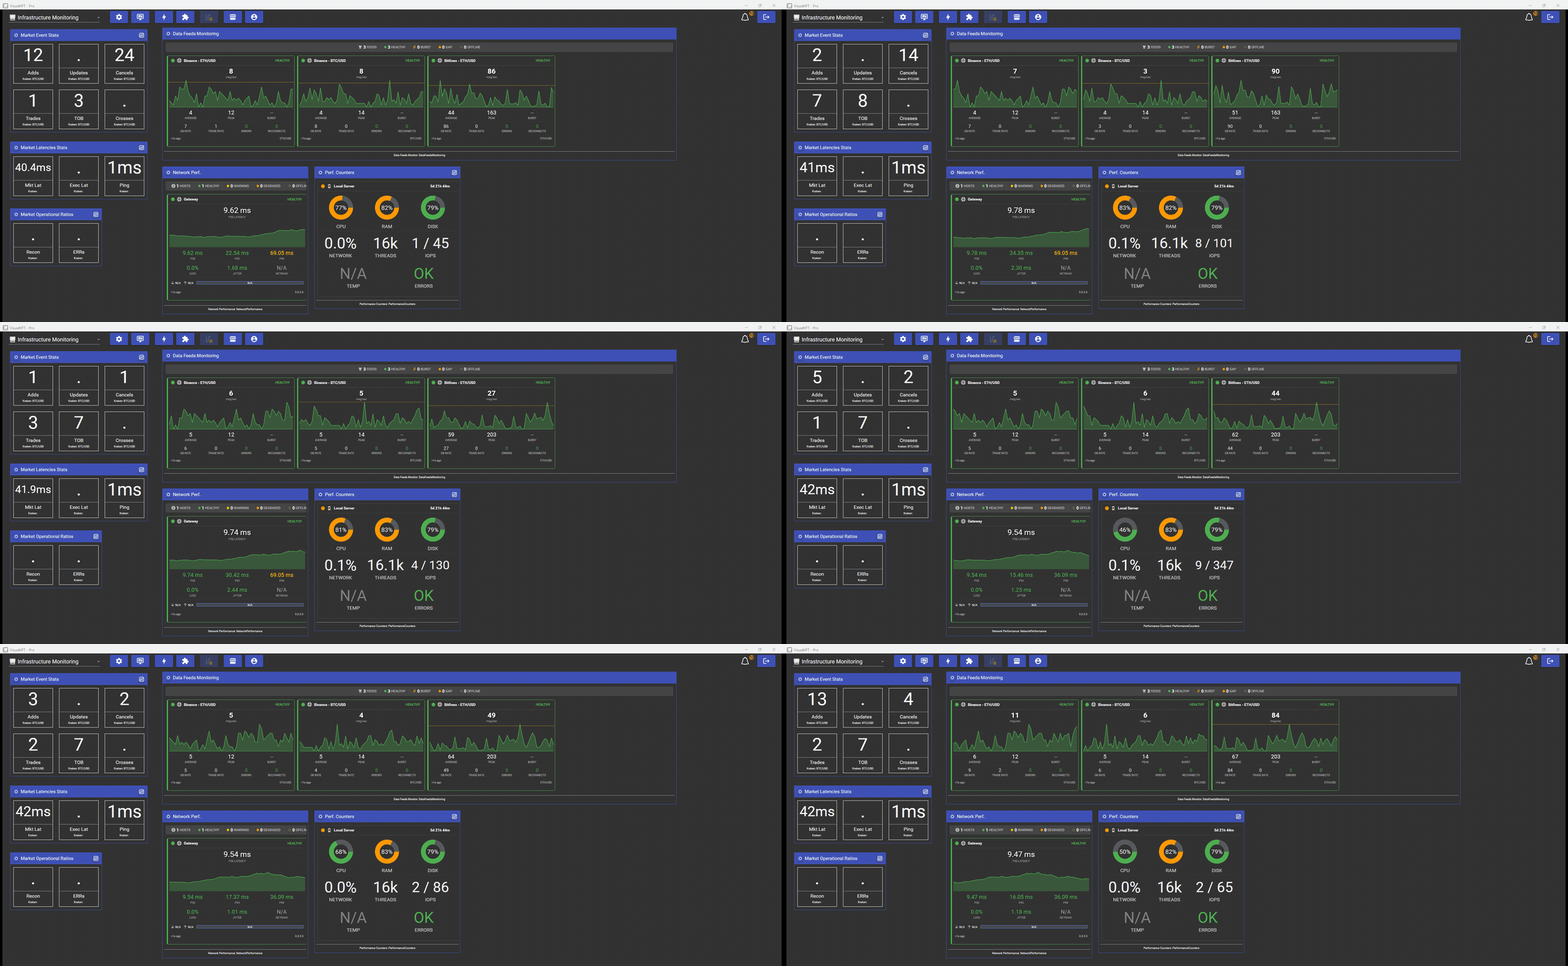
VisualHFT Terminal ships a dedicated Infrastructure Monitoring dashboard: a built-in layout that hosts six study plugins, included in the installer and unlocked by a Core plan. There is nothing extra to buy and nothing extra to install.
This page covers all six. For each one it states what the number on screen measures, which line of the shipping code produces it, what you configure, and what it publishes to the alerting engine. The last sections cover turning any of it into an alert and keeping a history.
What the dashboard contains
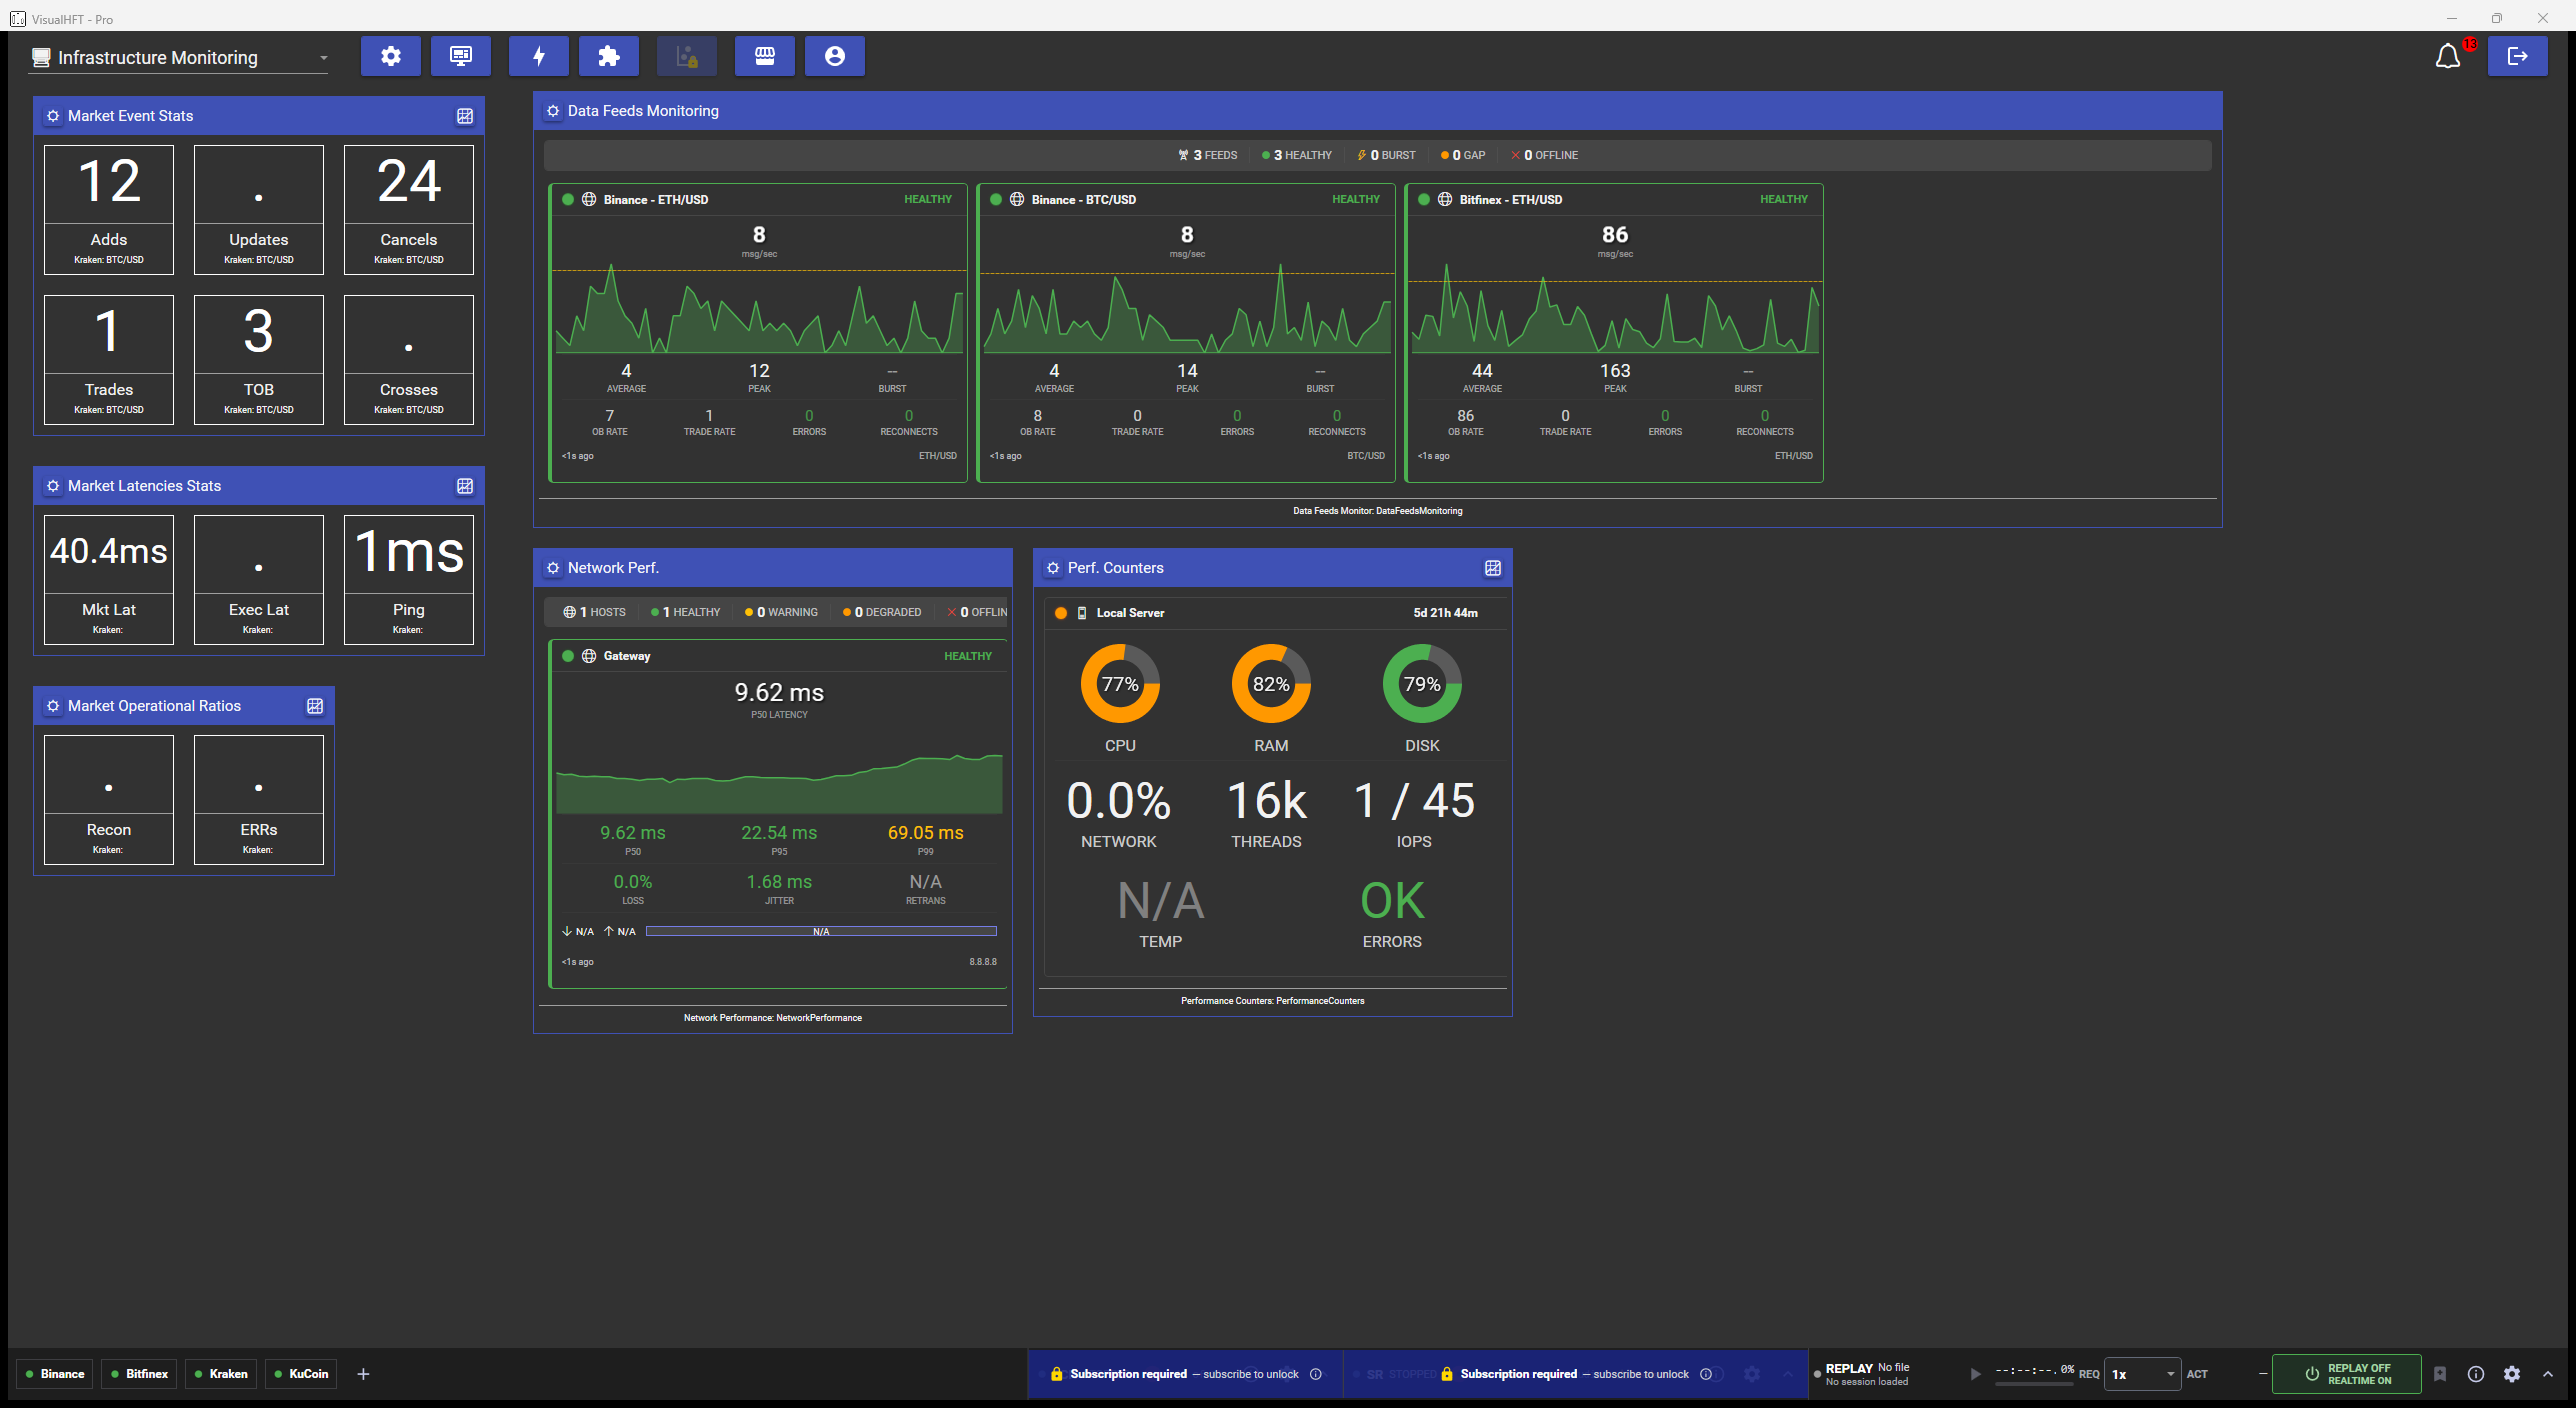
Everything on this page lives on one screen, and the point of that screen is to let you answer where is the problem without opening anything else. Six plugins run at once: three watching the venue connection, one watching the path to it, one watching the machine you run on, and one watching the shape of the order book itself.
Open the dashboard picker in the top left and choose Infrastructure Monitoring.
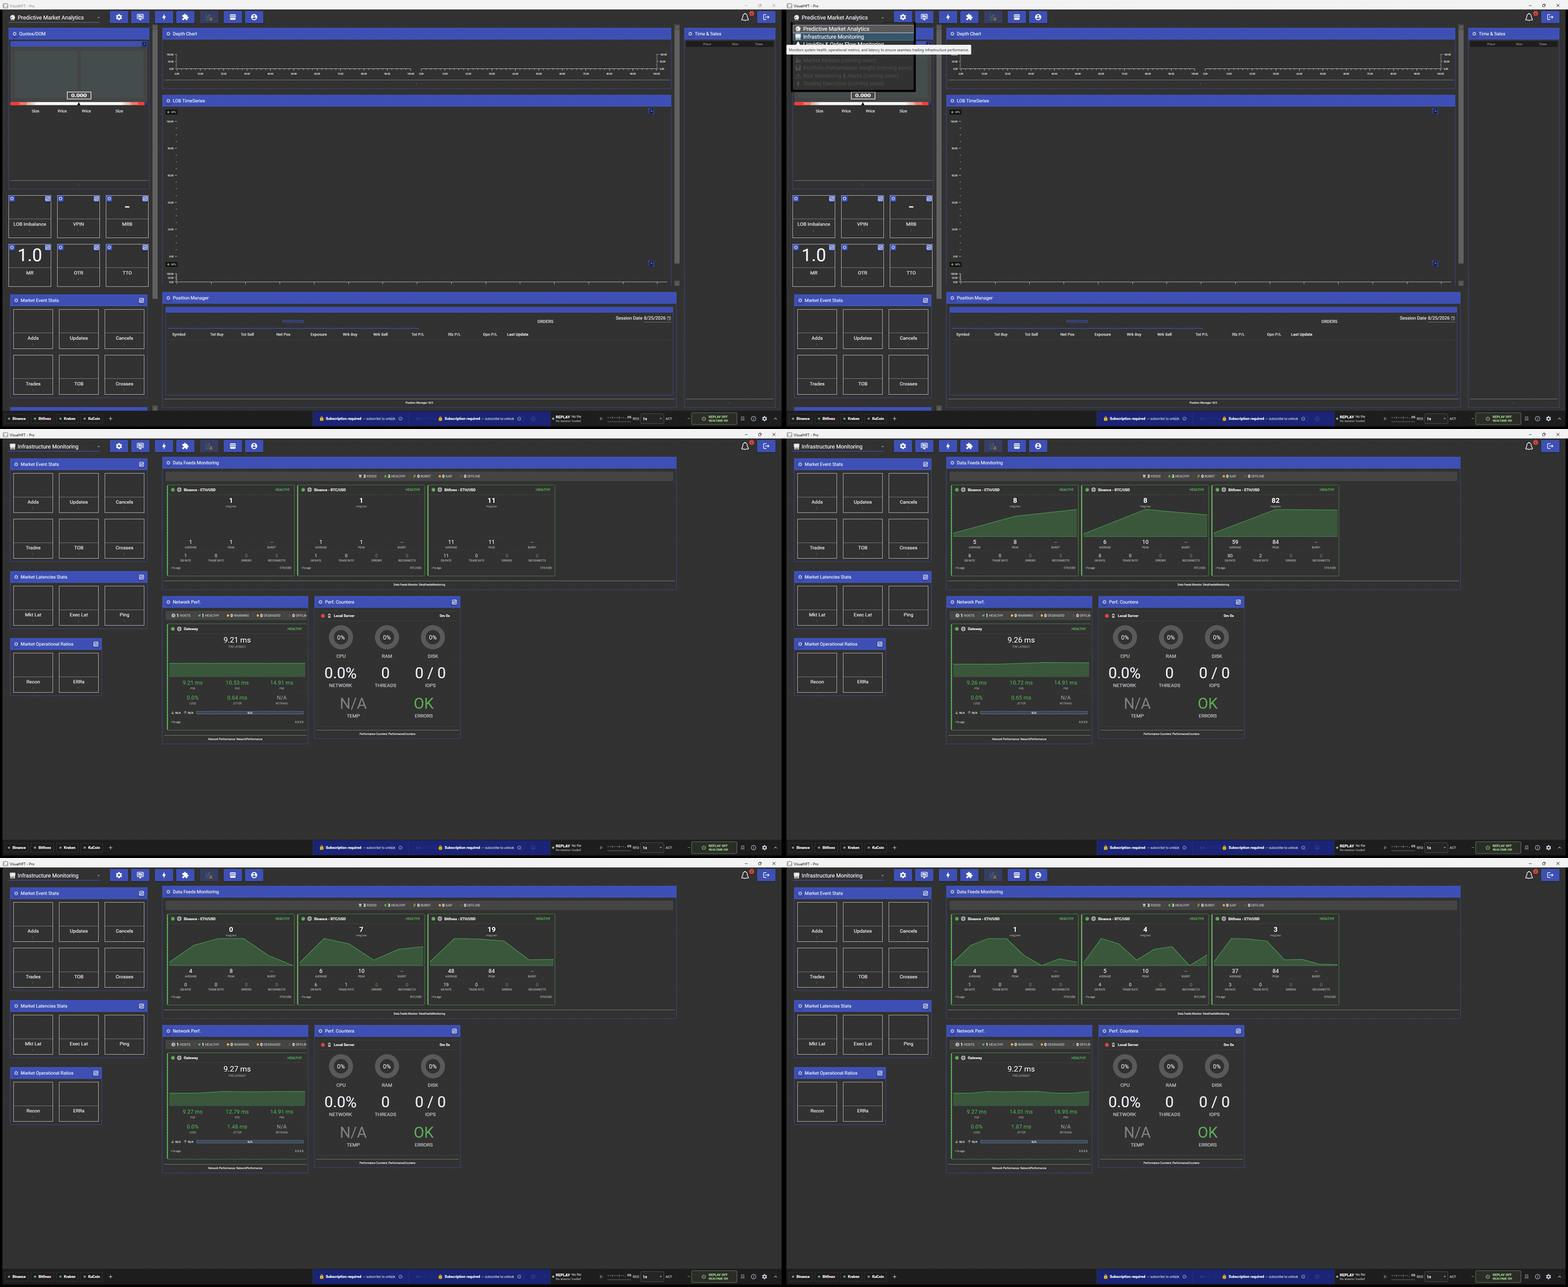
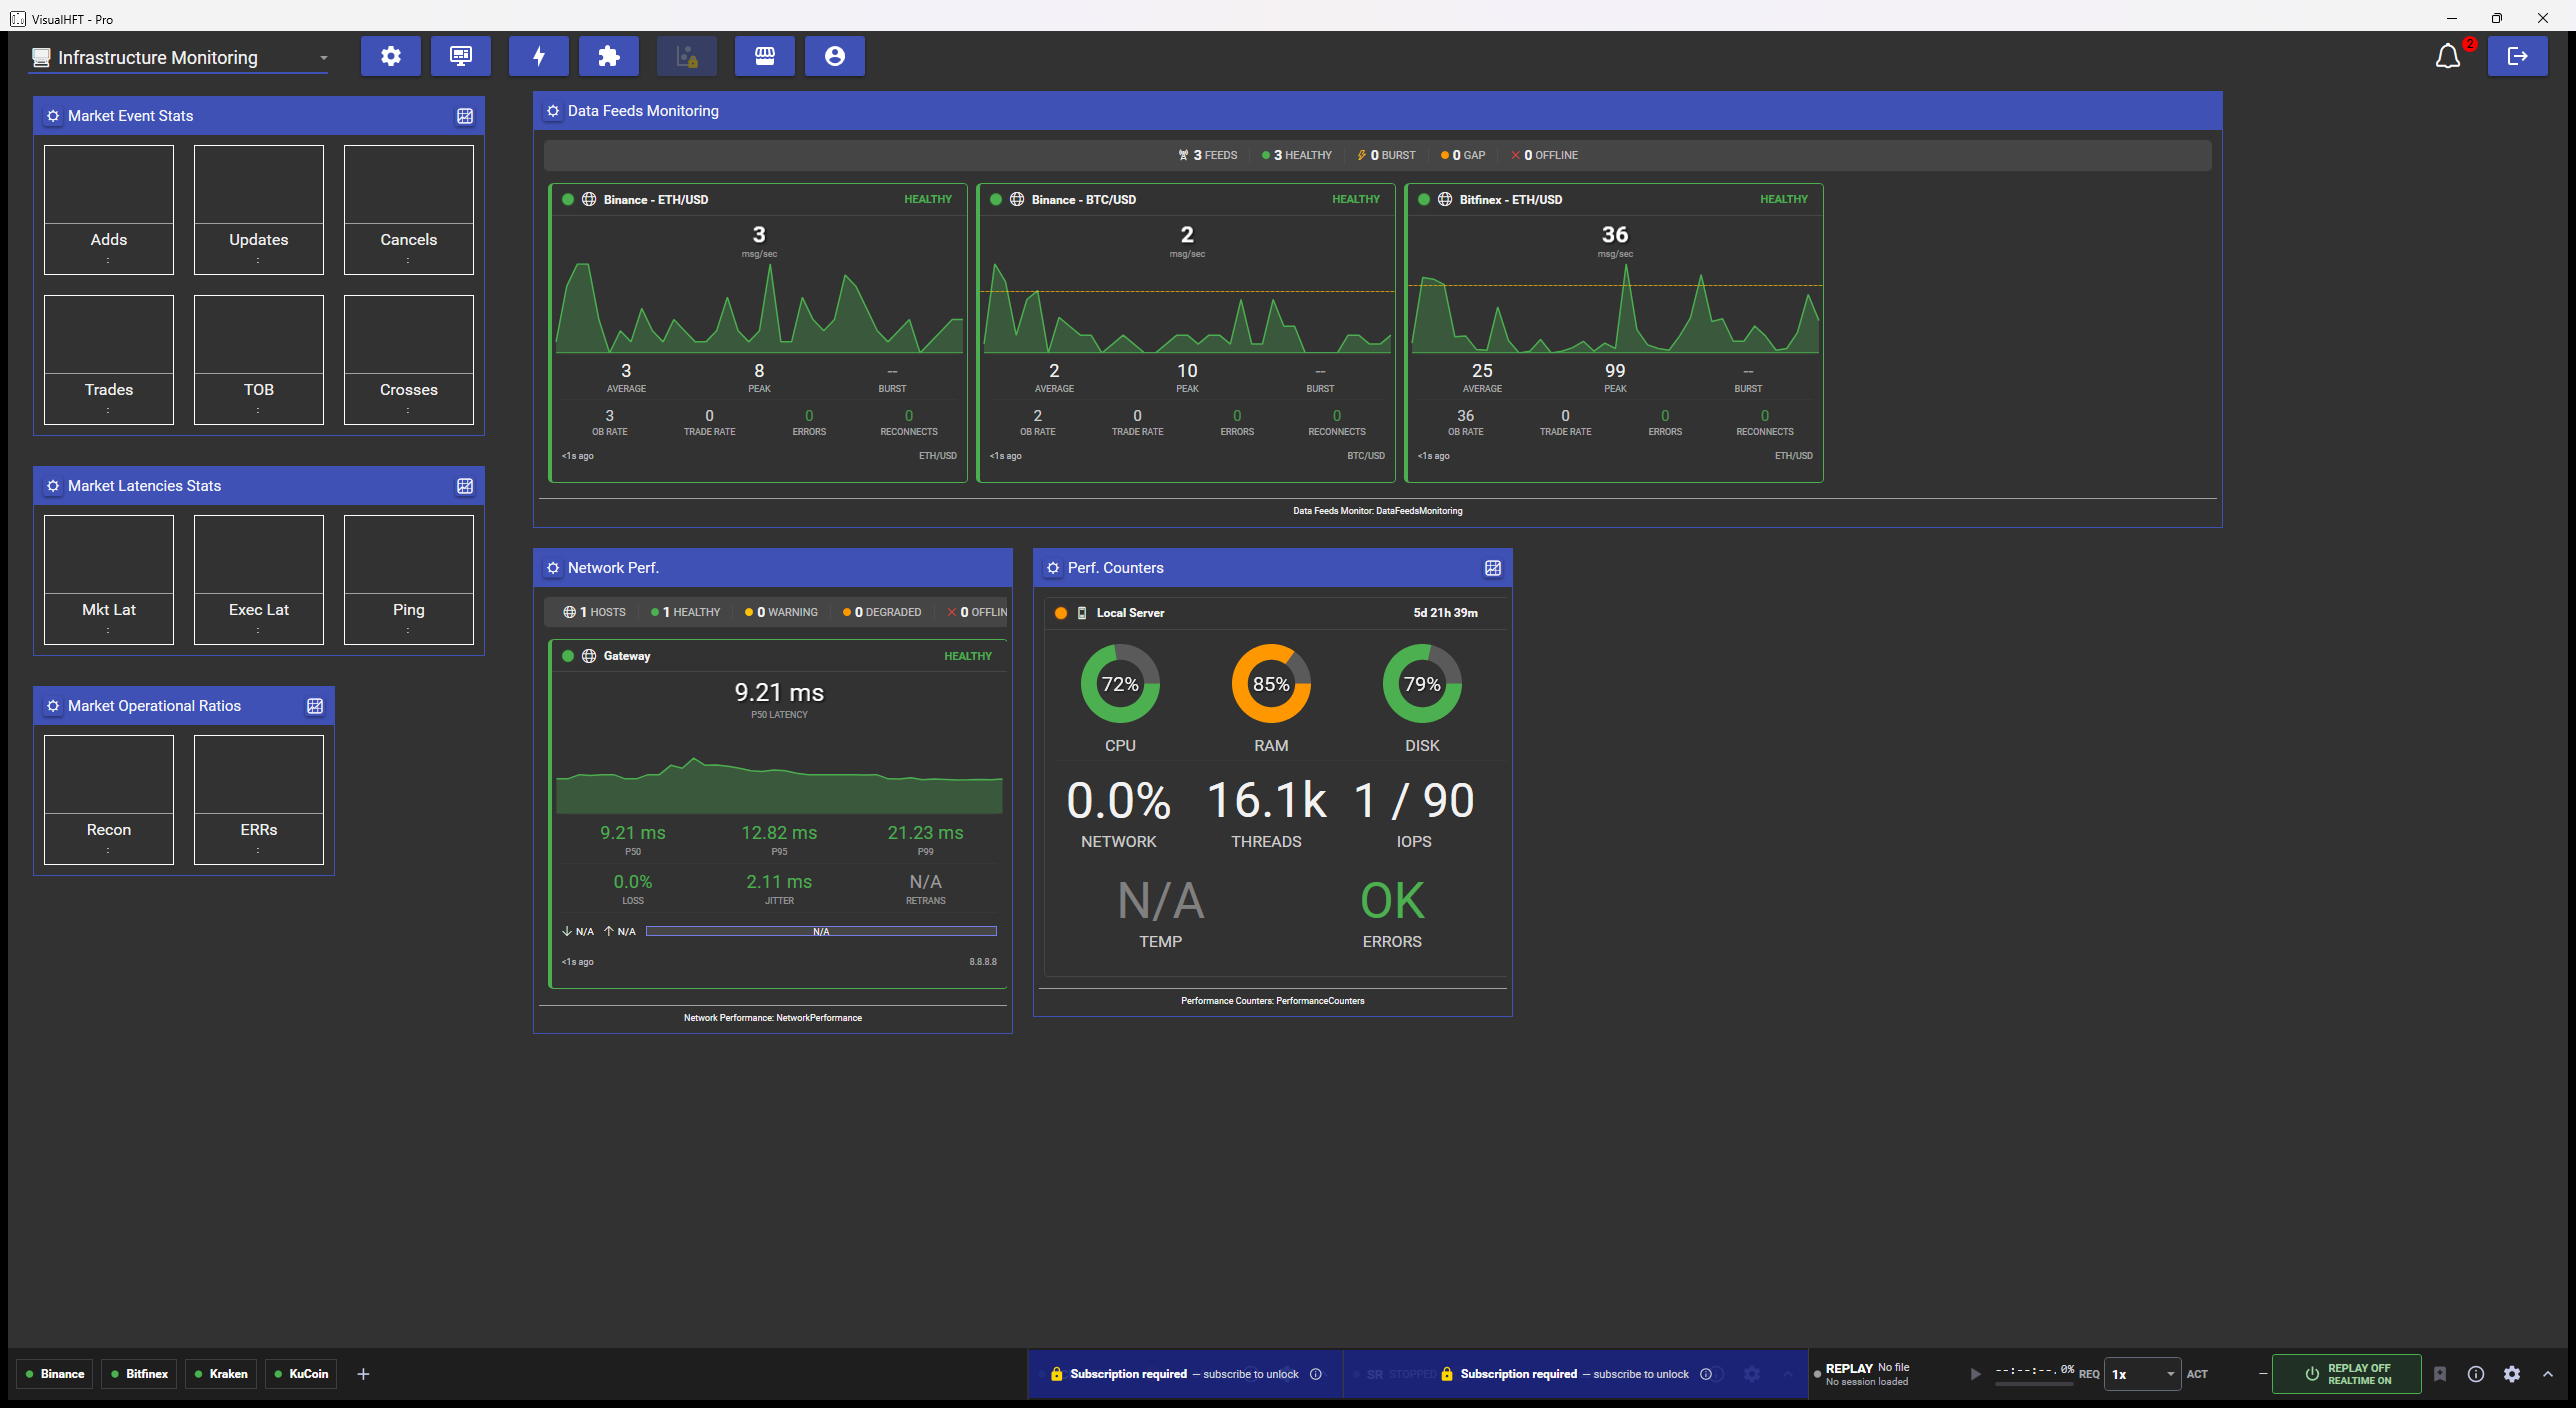
The layout is fixed in code, not user-arranged. Six slots, in this order
(DashboardManager/DashboardManager.cs:173-183):
| Slot | Plugin | What it watches |
|---|---|---|
| Left, 1st | Market Event Stats | Order-book event rates per second: adds, updates, cancels, trades, top-of-book changes, crossed books |
| Left, 2nd | Market Latencies Stats | Market data, execution and ping latency for one venue |
| Left, 3rd | Market Operational Ratios | Reconnections and connector errors for one venue |
| Centre, 1st | Data Feeds Monitoring | Per feed message rate, burst, gap, health, for many venue and symbol pairs at once |
| Centre, 2nd | Network Performance Monitoring | ICMP or SSH path quality to each remote host you add: latency percentiles, loss, jitter, retransmits, bandwidth |
| Centre, 3rd | Performance Counters Remote Servers | CPU, memory, disk, network, threads, IOPS and uptime on each server you add |
Two of these watch your machines. Four watch the venue connection. That split is the useful way to think about the dashboard: when something goes wrong you want to know which side of the wire it happened on.
Feature availability
All six are bundled. None is a separate purchase.
| Plugin | Plan required | Bundled or add-on | Delivered how |
|---|---|---|---|
| Market Event Stats | Core | Bundled | In the installer |
| Market Latencies Stats | Core | Bundled | In the installer |
| Market Operational Ratios | Core | Bundled | In the installer |
| Data Feeds Monitoring | Core | Bundled | In the installer |
| Network Performance Monitoring | Core | Bundled | In the installer |
| Performance Counters Remote Servers | Core | Bundled | In the installer |
Every one declares RequiredLicenseLevel = eLicenseLevel.CORE in its own source, and the shipping
catalog lists all six at the same tier floor, included with the plan rather than sold separately
(scripts/seed-marketplace.js). See current plan availability.
First run: point the three counter groups at a venue
The three counter groups on the left are per-venue studies: you choose which venue each one watches. The feed, network and server panels start producing numbers on their own.
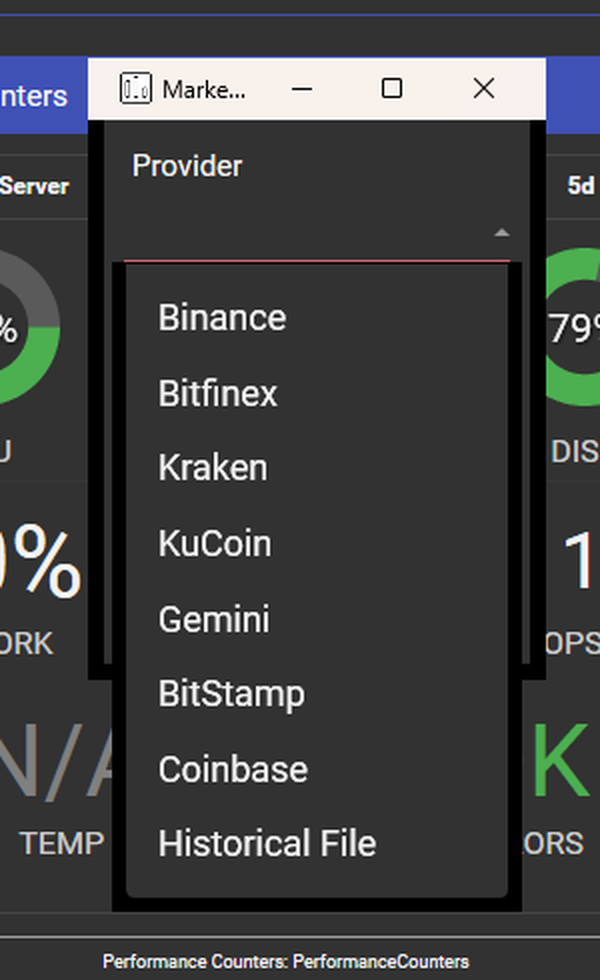
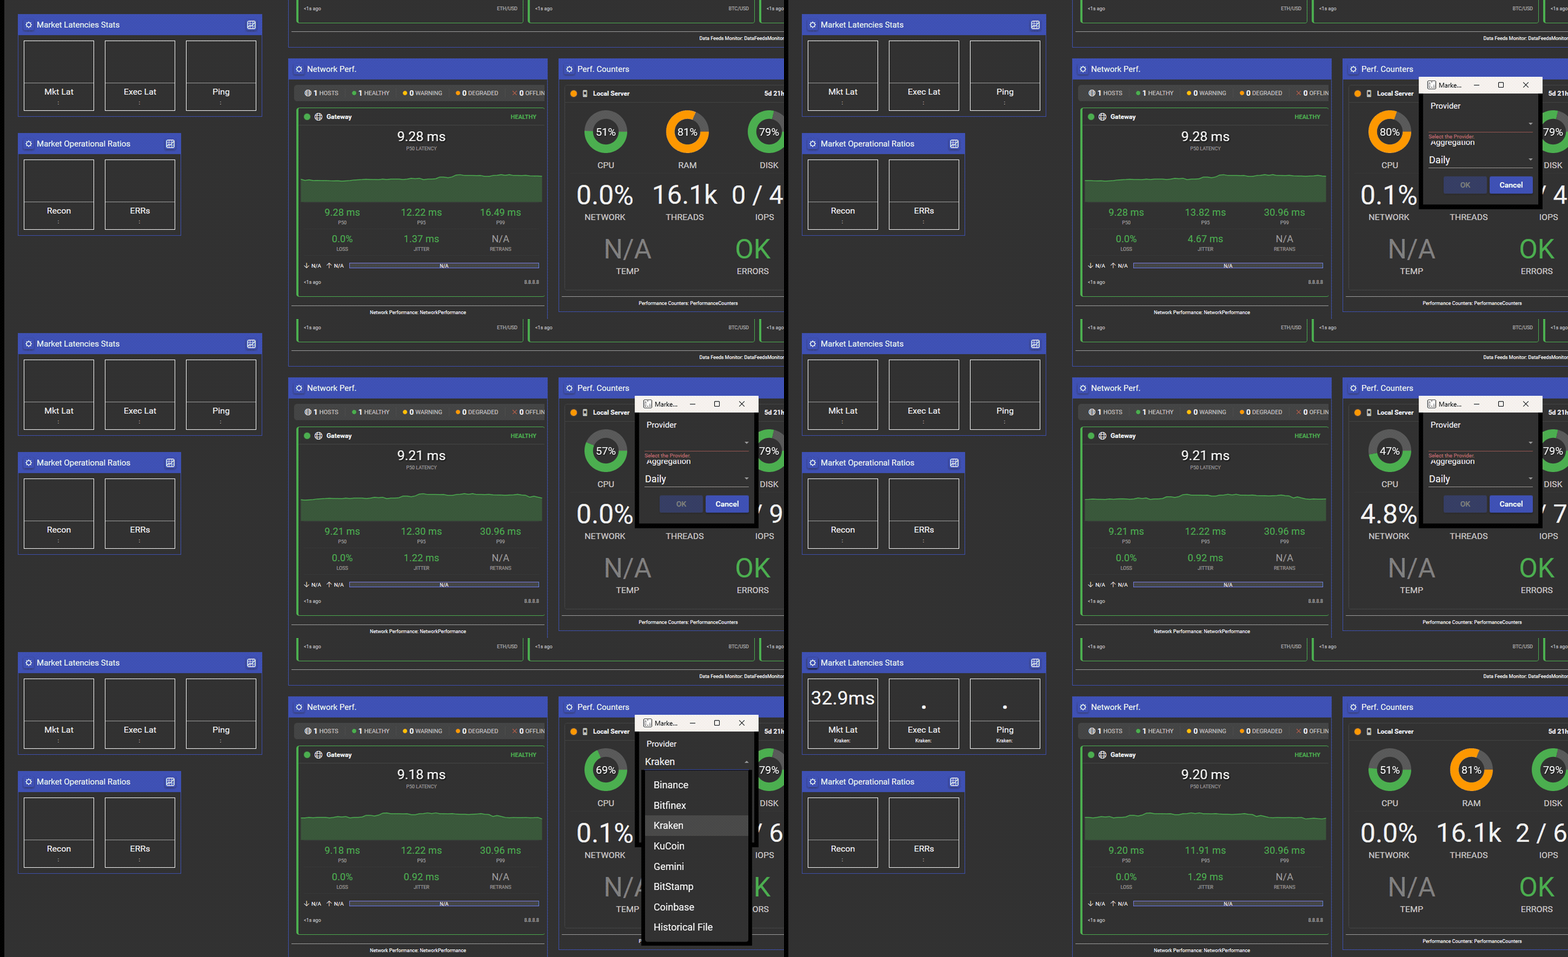
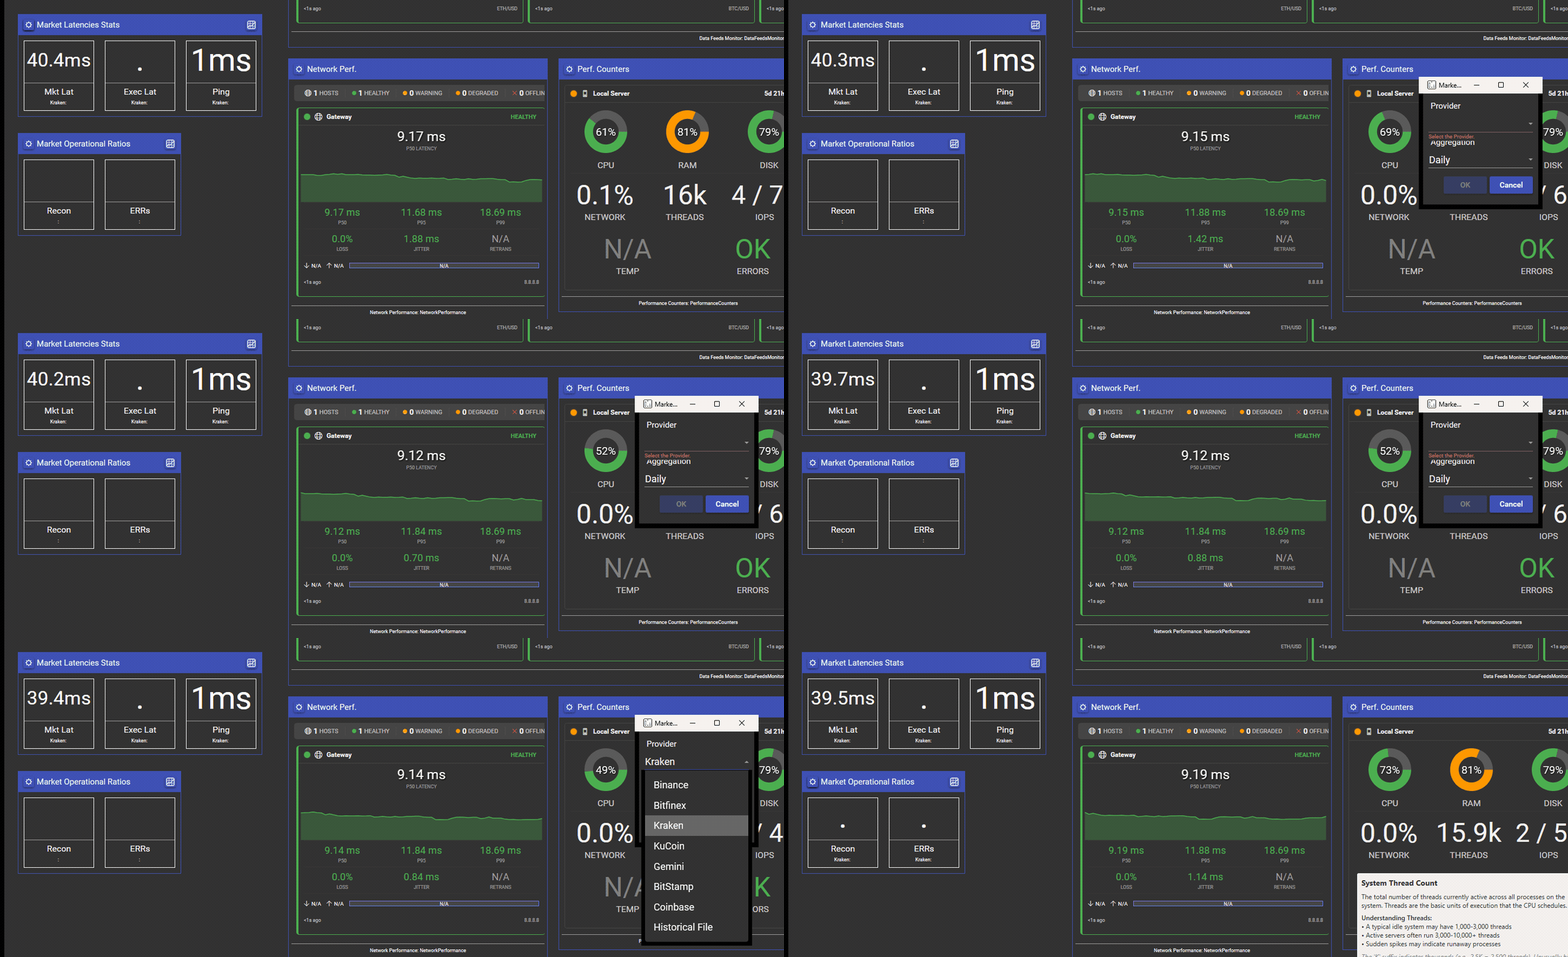
Point each of them at a venue through its own settings gear. The dialog is the same for all three: a Provider list, an Aggregation interval, and, for Market Event Stats only, a Symbol list.
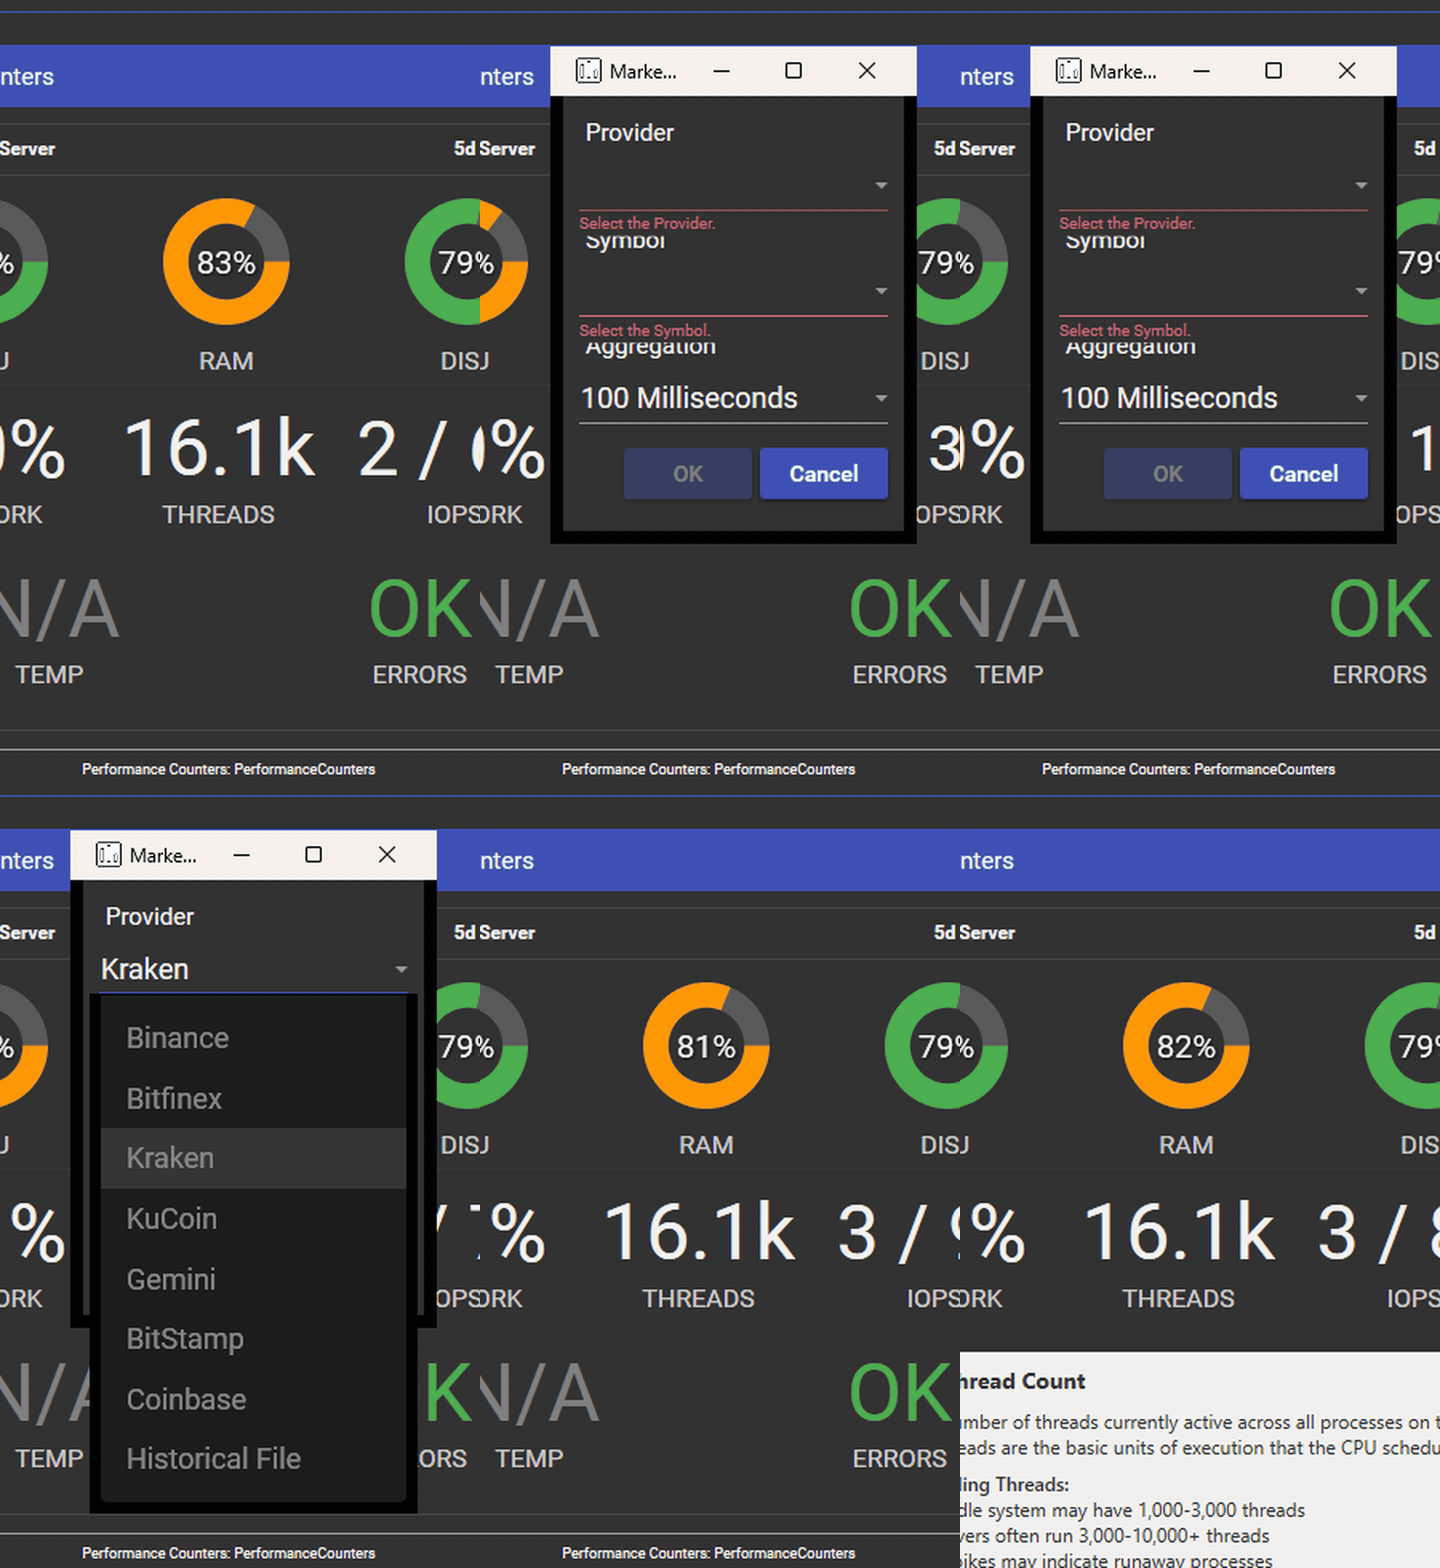
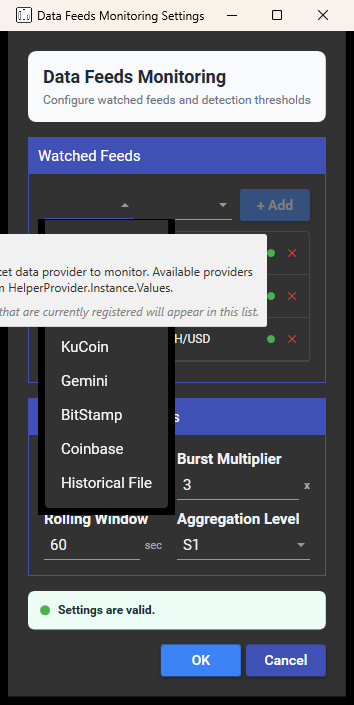
The provider list contains every connector that is loaded, including the Replay Engine under the
name Historical File, so the same counters work over a replayed capture.
Two things worth knowing about these three dialogs:
- Market Latencies Stats and Market Operational Ratios report venue-wide. They filter on the provider, so everything those two show covers the whole venue rather than one instrument, and their dialog asks you for a provider only.
OKapplies the change immediately. Saving pushes the new settings into every child counter and restarts each one (MarketDataStatsStudies.cs:592-605), so the counters begin a fresh accumulation from that moment.
A dot instead of a number means no data point yet, not zero. You will see it on Exec Lat
without your own order flow, on Recon and ERRs while nothing has gone wrong, and on any counter
that has not produced a single sample since the study started. It is the tile saying it has nothing
to report rather than reporting nothing. Once a counter has reported once it keeps its last reading,
so a quiet interval leaves the previous number on screen rather than returning to a dot.
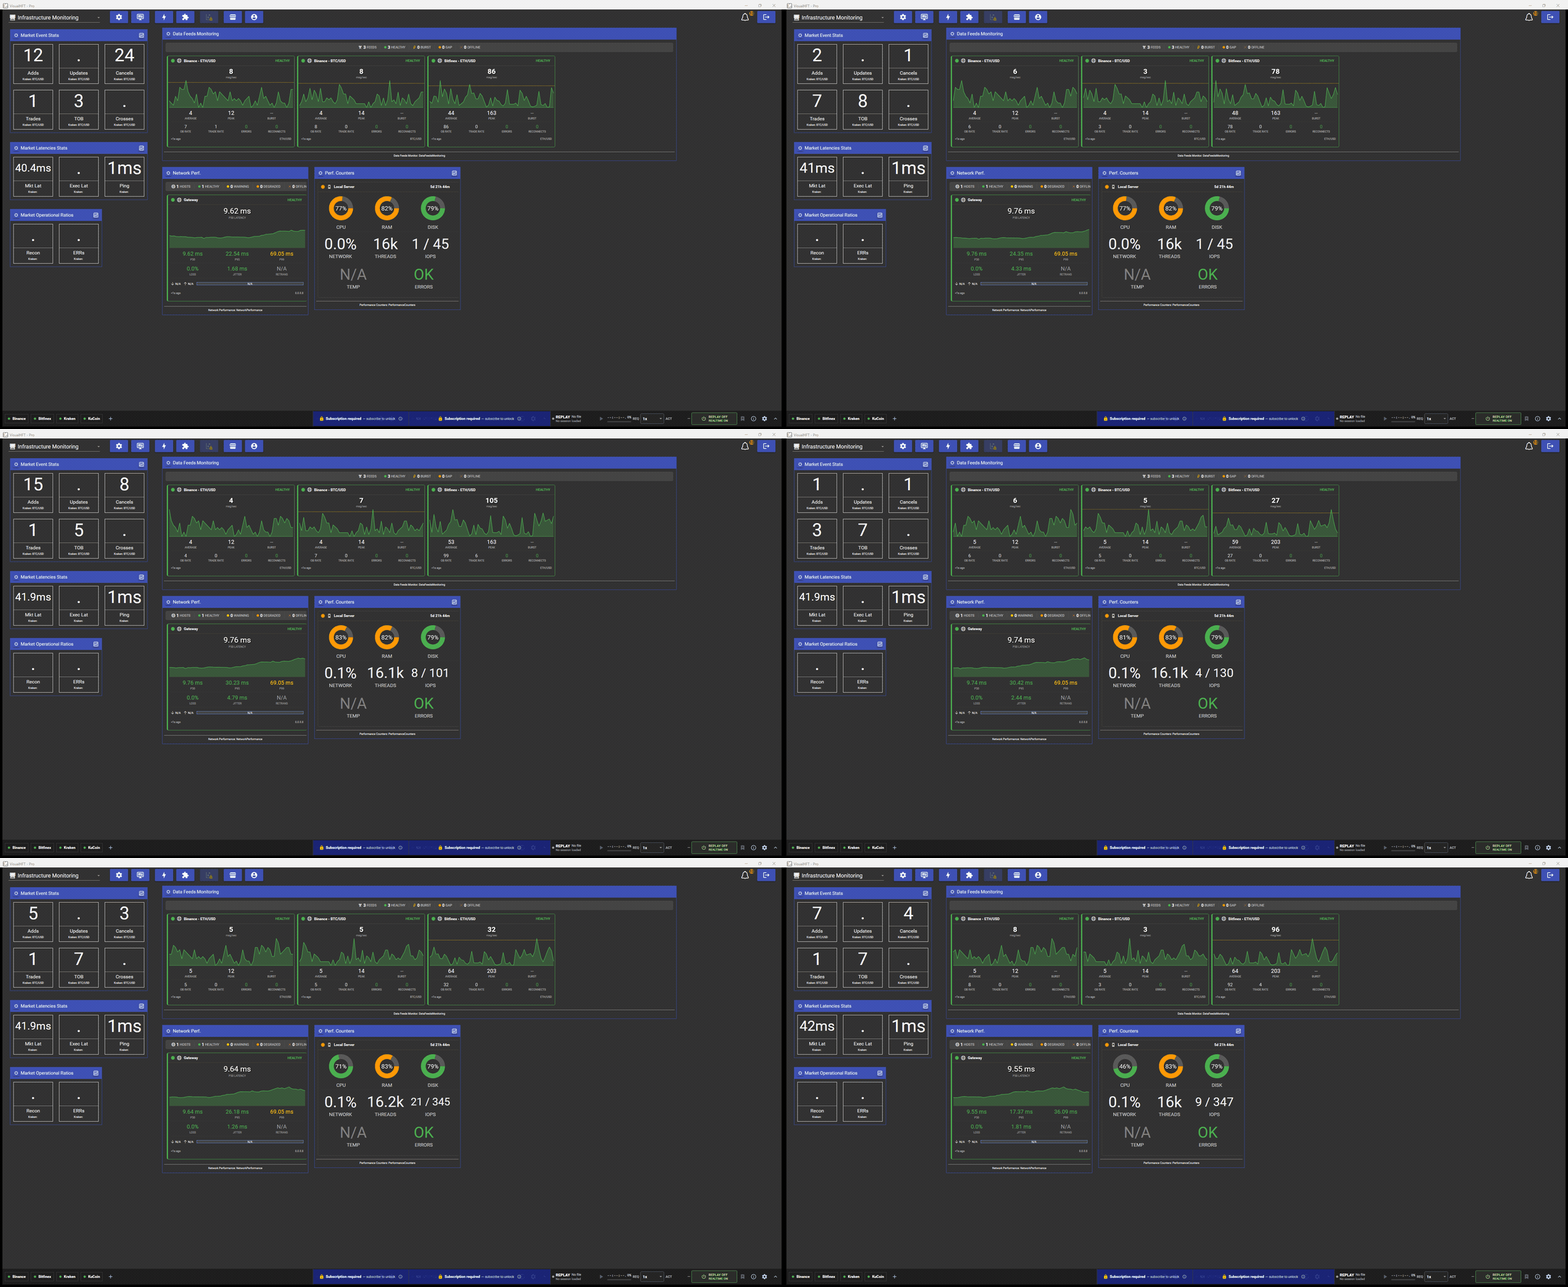
Once configured the dashboard fills in.
Data Feeds Monitoring
The centrepiece. It answers one question for every venue and symbol you care about at once: is this feed still healthy, right now?
Why watch feed health
A feed that stops does not raise an error. Every number downstream of it, your book, your signals, your risk, is computed from messages that arrived, so when they stop arriving the numbers do not go wrong, they go stale, and a stale number looks exactly like a calm market. This plugin is what separates “the market is quiet” from “we are not receiving”. It is also the only surface here that watches many venue and symbol pairs side by side, which is what makes a venue-specific problem obvious: one card gaps while the others keep moving.
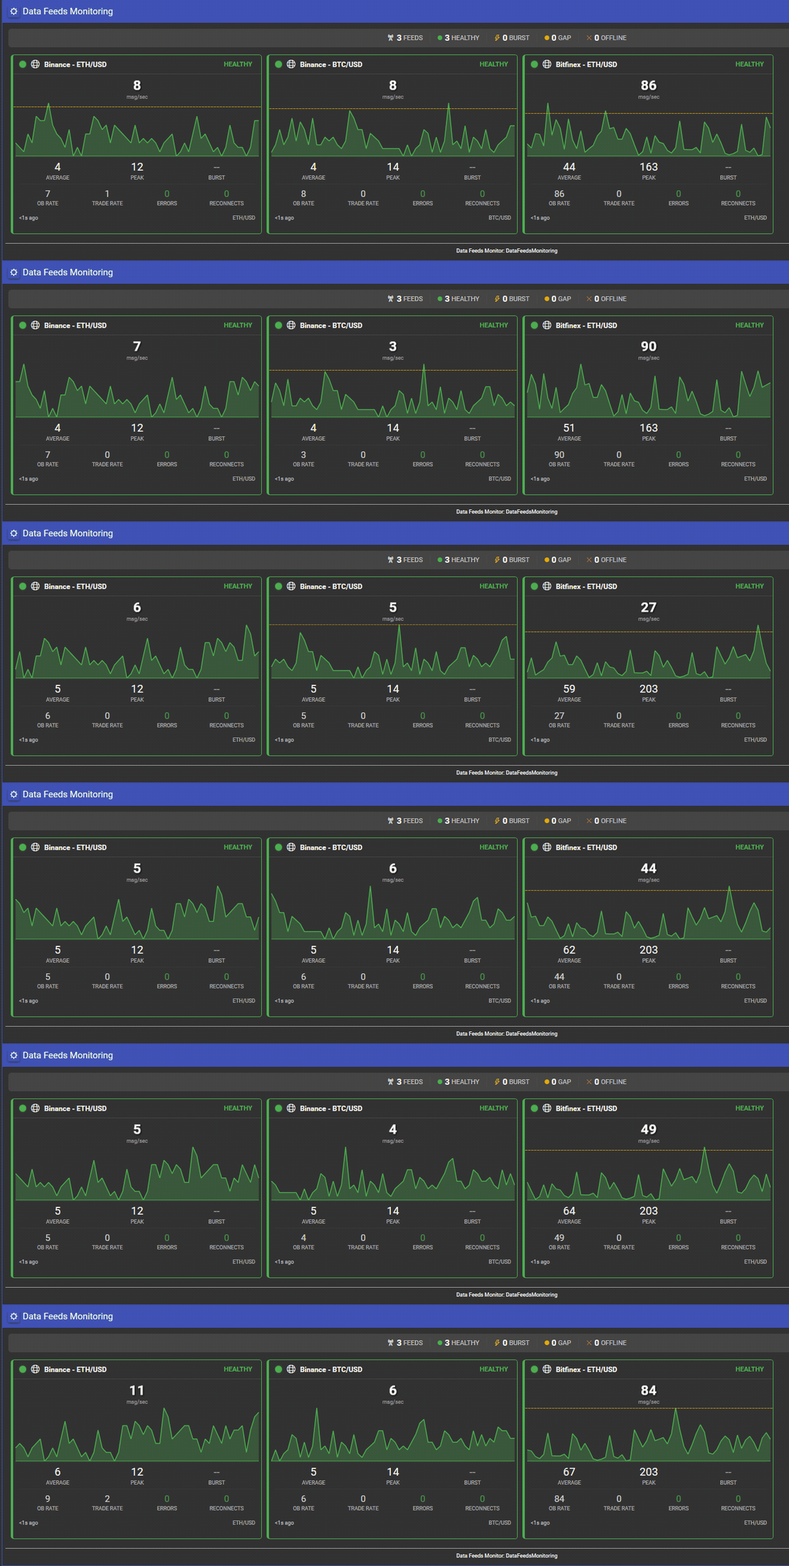
What a feed card measures
The plugin subscribes to the same order-book and trade streams every study consumes, and increments
per-message atomic counters keyed on a packed (providerID, symbolHash) long. A one-second
background timer reads and resets those counters and derives everything else
(Helpers/FeedMetricsTracker.cs:247-290).
| Card field | Meaning |
|---|---|
Big number, msg/sec | Combined order-book plus trade messages in the last one-second tick |
AVERAGE | The rolling baseline: an exponential moving average over the configured window |
PEAK | Highest one-second rate seen since the plugin started |
BURST | Current rate divided by the baseline, shown only while a burst is active |
OB RATE / TRADE RATE | The same tick split into order-book and trade messages |
ERRORS | Operational errors on this feed. Connector faults are raised against the whole provider, so they are counted against every watched pair on that venue (Helpers/FeedMetricsTracker.cs:352) |
RECONNECTS | Genuine recoveries on this provider: a transition from disconnected back to connected. The first connect and a retry that never completed are not counted, so any reading above zero is a connection you actually lost (Helpers/FeedMetricsTracker.cs:388-428) |
| Sparkline | The last 60 one-second samples, with a dashed overlay drawn at the detector’s real trigger level: the rolling average times your configured burst multiplier (ViewModels/FeedMetricsViewModel.cs:361-365) |
The header strip above the cards totals the fleet: how many feeds, and how many are healthy, bursting, gapped or offline.
Health is a strict priority ladder
ComputeHealthFor returns the first match, in this order
(Helpers/FeedMetricsTracker.cs:436-446):
- Offline if the provider reported disconnected.
- Degraded if a gap is currently open.
- Warning if a burst is active, or the feed is approaching its gap threshold, or an error arrived recently.
- Healthy otherwise.
So a feed that is bursting and gapped reads Degraded: the card always shows the more serious condition.
Two things make that ladder useful rather than noisy. The Warning tier includes the
approaching-gap state, so a feed slowing down shows amber before it shows Degraded rather than
jumping straight there. And an error contributes Warning only while it is recent, on a
60-second recency window, so one transient error cannot hold the card amber for the rest of the
session. The cumulative ERRORS figure on the card still counts every error.
Burst detection
A burst fires when the current one-second rate exceeds burstMultiplier times the rolling average
(Helpers/BurstDetector.cs:56-64). The average is an EMA with alpha = 2 / (windowSeconds + 1).
Two behaviours worth knowing:
- The first
windowSecondssamples build the baseline. The detector accumulates a simple average over that period, so every burst it flags afterwards is measured against a real baseline. With the default 60-second window that is the first minute after the plugin starts. - The comparison uses the previous EMA, before the current sample is folded in, so a single large tick cannot mask itself.
Gap detection
A gap opens when no message has arrived for longer than GapThresholdMs
(Helpers/GapDetector.cs:43-70). The detector holds off for the first GapThresholdMs after start,
and again after every reconnection, so a feed that is still coming up is given time to deliver.
Past half that threshold the detector reports approaching a gap, and the card goes to Warning. That is the state to alert on: it is the earliest moment you can tell a feed is slowing down, and it arrives before the gap itself.
Configuring watched feeds
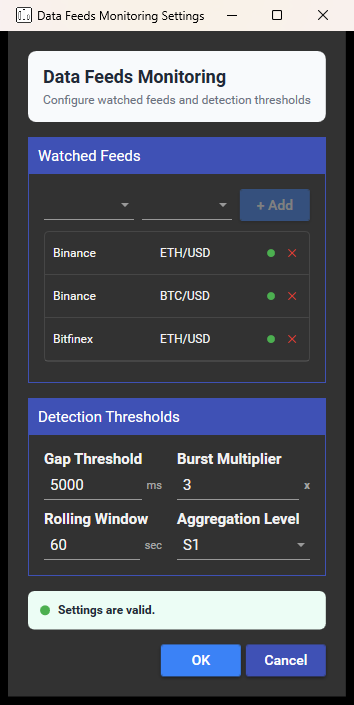
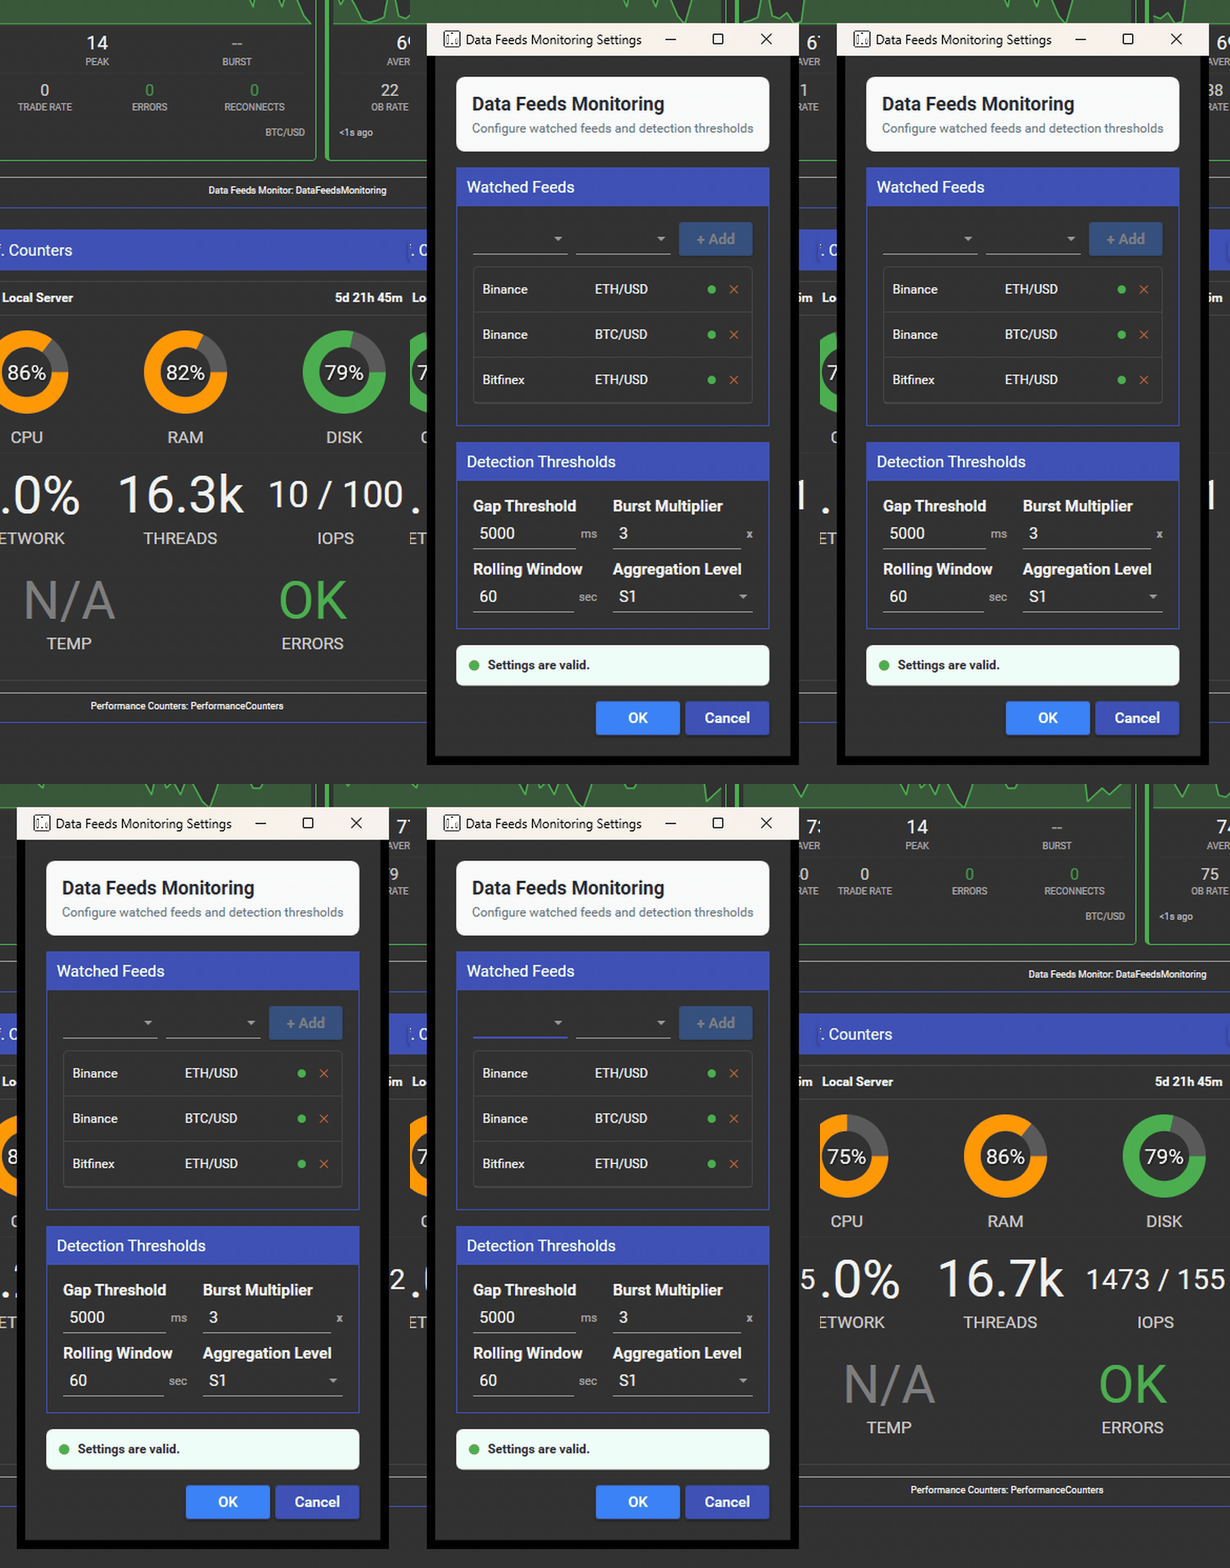
Pick a provider, pick a symbol, press + Add, repeat. Watch as many provider and symbol pairs as you need.
| Setting | Default | Accepted range | Effect |
|---|---|---|---|
| Gap threshold | 5000 ms | 1 to 60000 | Silence longer than this opens a gap and marks the feed Degraded. Past half of it the card is already Warning |
| Burst multiplier | 3.0 | above 1.0, up to 100.0 | Rate above this multiple of the baseline flags a burst |
| Rolling window | 60 s | 5 to 3600 | EMA window for the baseline, and the cold-start period |
| Aggregation | S1 | picker | Study aggregation level |
Out-of-range values are caught in the dialog and explained, so what you see saved is what the
plugin runs on (Studies.DataFeedsMonitoring/ViewModels/PluginSettingsViewModel.cs → ValidateSettings).
If you have never configured it, the plugin auto-selects up to three provider and symbol pairs from
whatever is connected the first time it starts, so it is useful before you touch it
(DataFeedsMonitoringPlugin.cs:98-134).
Feed metrics published for alerting
Five metrics per watched pair, once per second, tagged {Provider}:{Symbol} - {Metric}:
Message Rate, Burst Magnitude, Gap Duration Sec, Error Count, Trade Rate
(DataFeedsMonitoringPlugin.cs:312-327).
Cost
The per-message hot path allocates nothing. A message for a feed you are not watching pays two
interlocked counter operations, one string-keyed dictionary lookup and one hash-set probe, then
returns; a watched one adds a second dictionary lookup, an Interlocked.Increment and one clock
read stored to its last-seen timestamp (Helpers/FeedMetricsTracker.cs:188-195). All derivation
happens on the one-second timer, off the market-data thread, so watching more feeds costs you
dashboard rows, not market-data throughput.
Network Performance Monitoring
Measures the quality of the network path between this machine and every remote host you point it at.
Why watch the network path
When a venue looks slow, the first question is always is it them, or is it the path to them?
Ping gives you a first cut, but it is a periodic REST sample against the venue’s own API. This is
the only plugin here that measures the path itself, at your own probe rate, against the hop you
choose. Feed rates and Mkt Lat both degrade the same way whether the venue slowed down or your
route did, and the two have completely different responses:
one is a venue problem you report, the other is a network problem you fix. Point this at the hop
that actually matters to you, your exchange gateway or your colocated box, and the answer is one
glance.
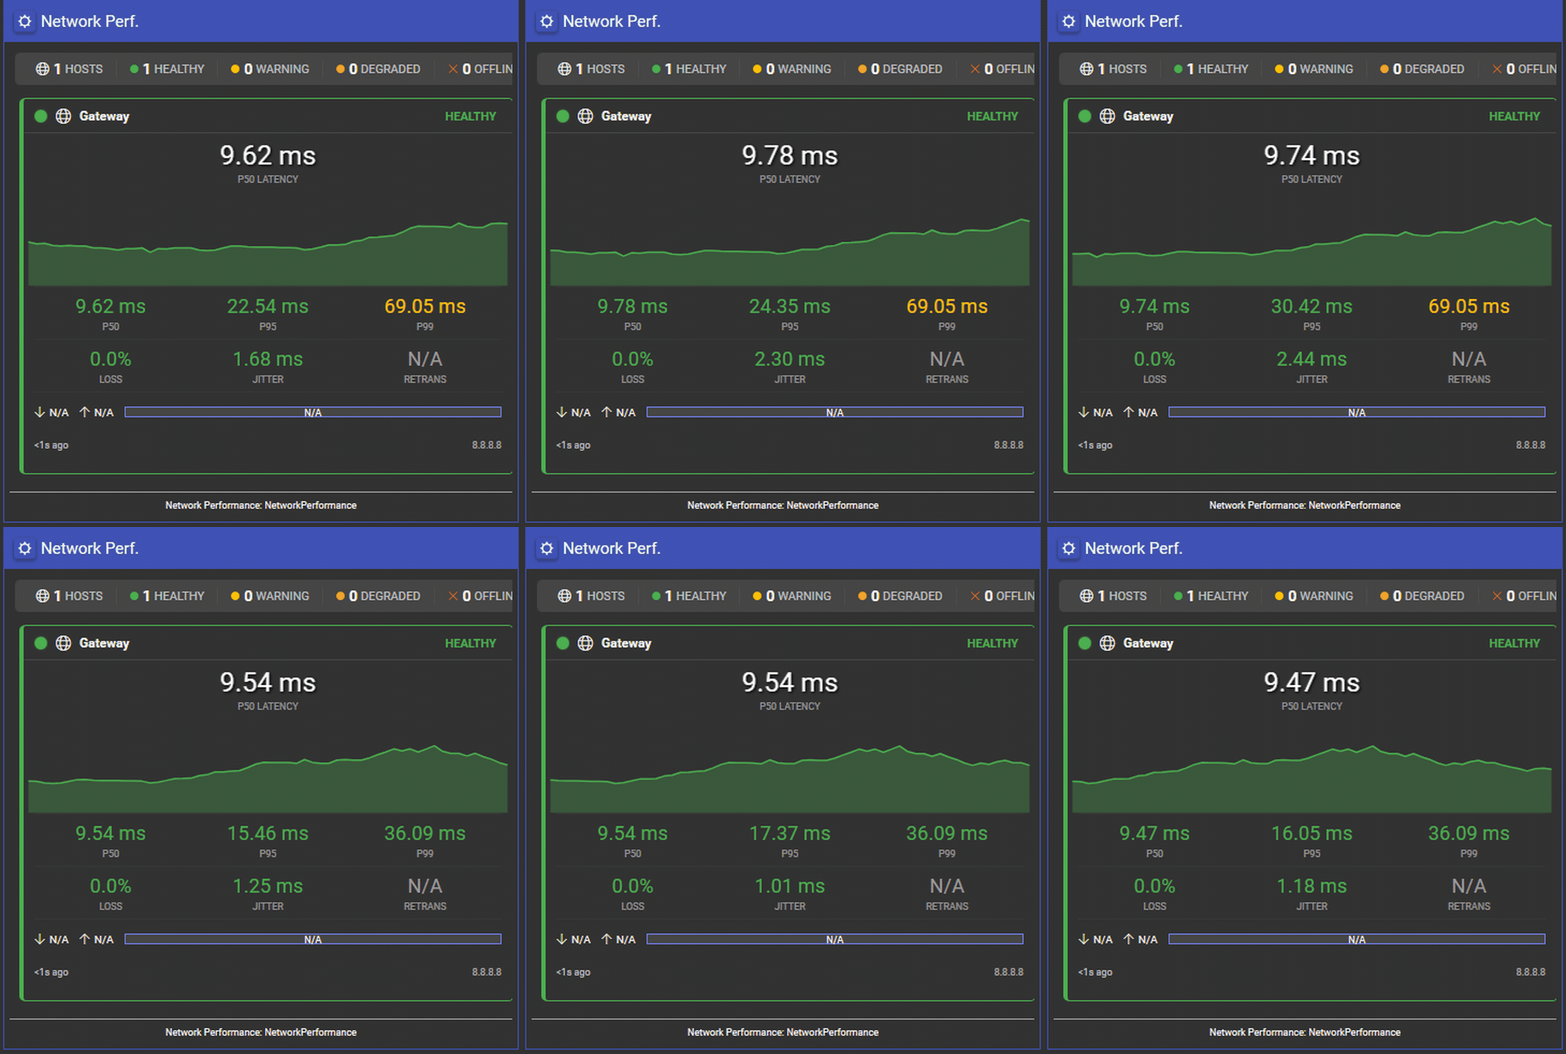
What a host card measures
Every collection cycle the plugin sends Ping Count probes at the host and feeds each
individual round-trip into the rolling window and into the RFC 3550 jitter average
(NetworkPerformancePlugin.cs:320-335). Percentiles are computed over that window with a
stack-allocated sort, so Latency P99 is a percentile of real probes: a single bad round trip
inside a cycle shows up instead of being averaged away before it is measured.
The window sizes itself from your settings rather than being fixed, at
ceil(RollingWindowSeconds / RefreshIntervalSeconds) x PingCount samples up to a 3,000 cap
(NetworkPerformancePlugin.cs:456-468). Raising the rolling window lengthens the lookback in
time, which is what you actually mean when you widen it, whatever probe count and refresh
interval you are running.
| Card field | Meaning |
|---|---|
Hero number, P50 LATENCY | Median of the individual probe round-trip times in the rolling window |
P50 / P95 / P99 | Percentiles over the same window |
LOSS | Percentage of probes in the cycle that did not come back |
JITTER | RFC 3550 exponential moving average of the inter-sample delta |
RETRANS | TCP segments retransmitted per second, read from the remote host |
| Bandwidth bar | Combined receive and transmit throughput as a percentage of the link capacity you configured |
Jitter is also computed as a plain standard deviation over the window, and the health status is derived from the warning and critical thresholds you set.
Two collection paths
The provider is chosen by the server’s OS Type (NetworkPerformancePlugin.cs:273):
Windows target. Ping Count ICMP echoes per cycle, each given Ping Timeout, sent from this
machine (Providers/WindowsNetworkProvider.cs:62-68). Both come from the dialog, defaulting to the
historical ten probes at 1,000 ms. Retransmit and bandwidth counters are read remotely
through Windows performance counters (TCPv4 \ Segments Retransmitted/sec and
Network Interface \ Bytes Total/sec against the target machine name). That remote read runs under
a one-second budget so it can never hold up the collection cycle
(Providers/WindowsNetworkProvider.cs:101-127). Where those counters are not exposed, a public IP
or a non-Windows host, the card shows N/A for retransmits and bandwidth and keeps reporting
latency, loss and jitter.
If that remote read overruns its budget once, VisualHFT stops attempting remote counters for
every Windows target for the rest of the session, so one unreachable host cannot cost a second
on every cycle thereafter (Providers/WindowsNetworkProvider.cs:51,73). The suspension is cleared
when the plugin restarts (NetworkPerformancePlugin.cs:105-114). So after you grant the account
access on the target, press OK in the settings dialog to pick the counters back up rather than
waiting for them to return on their own.
Linux target. One SSH session runs a single bash script that does everything in one pass:
ping -c $PING_COUNT -W $TIMEOUT using the same two settings, then /proc/net/snmp for
retransmits and /proc/net/dev for interface bytes, emitting one JSON line
(Providers/LinuxNetworkProvider.cs:101-147). One SSH round trip per cycle, whatever the metric.
The command budget for that round trip scales with the probe settings rather than being fixed
(Providers/LinuxNetworkProvider.cs:42-46), because ping -c N paces roughly one probe per second
and a lost probe waits out its full timeout. Raising Ping Count on a Linux target is therefore
safe: the budget grows with it.
Configuring a network target
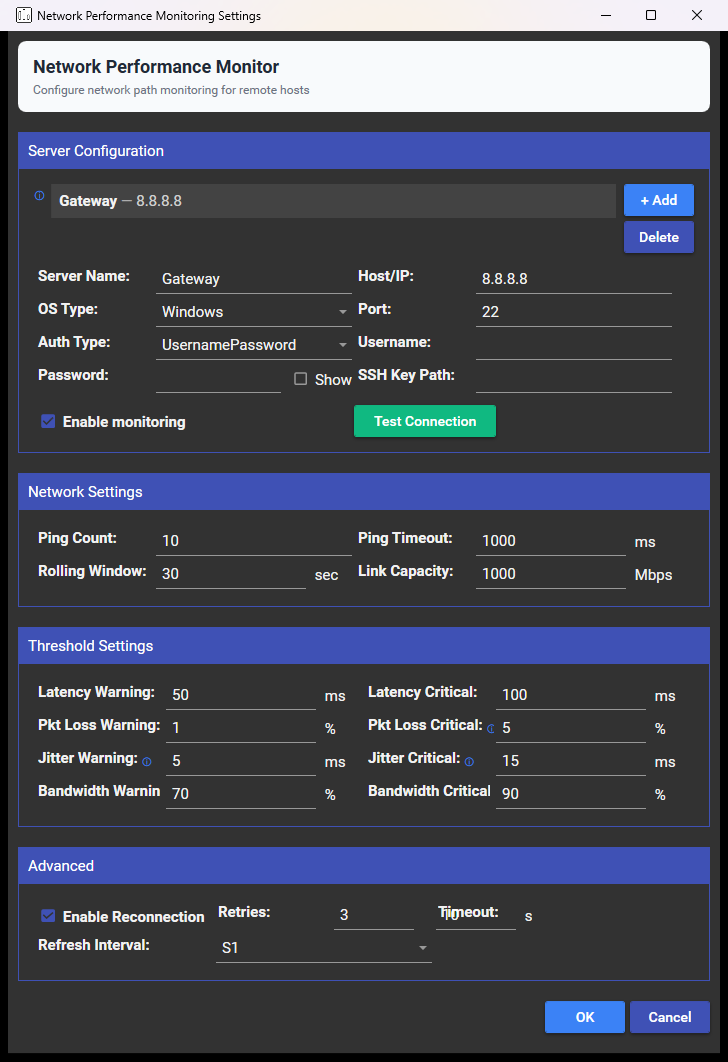
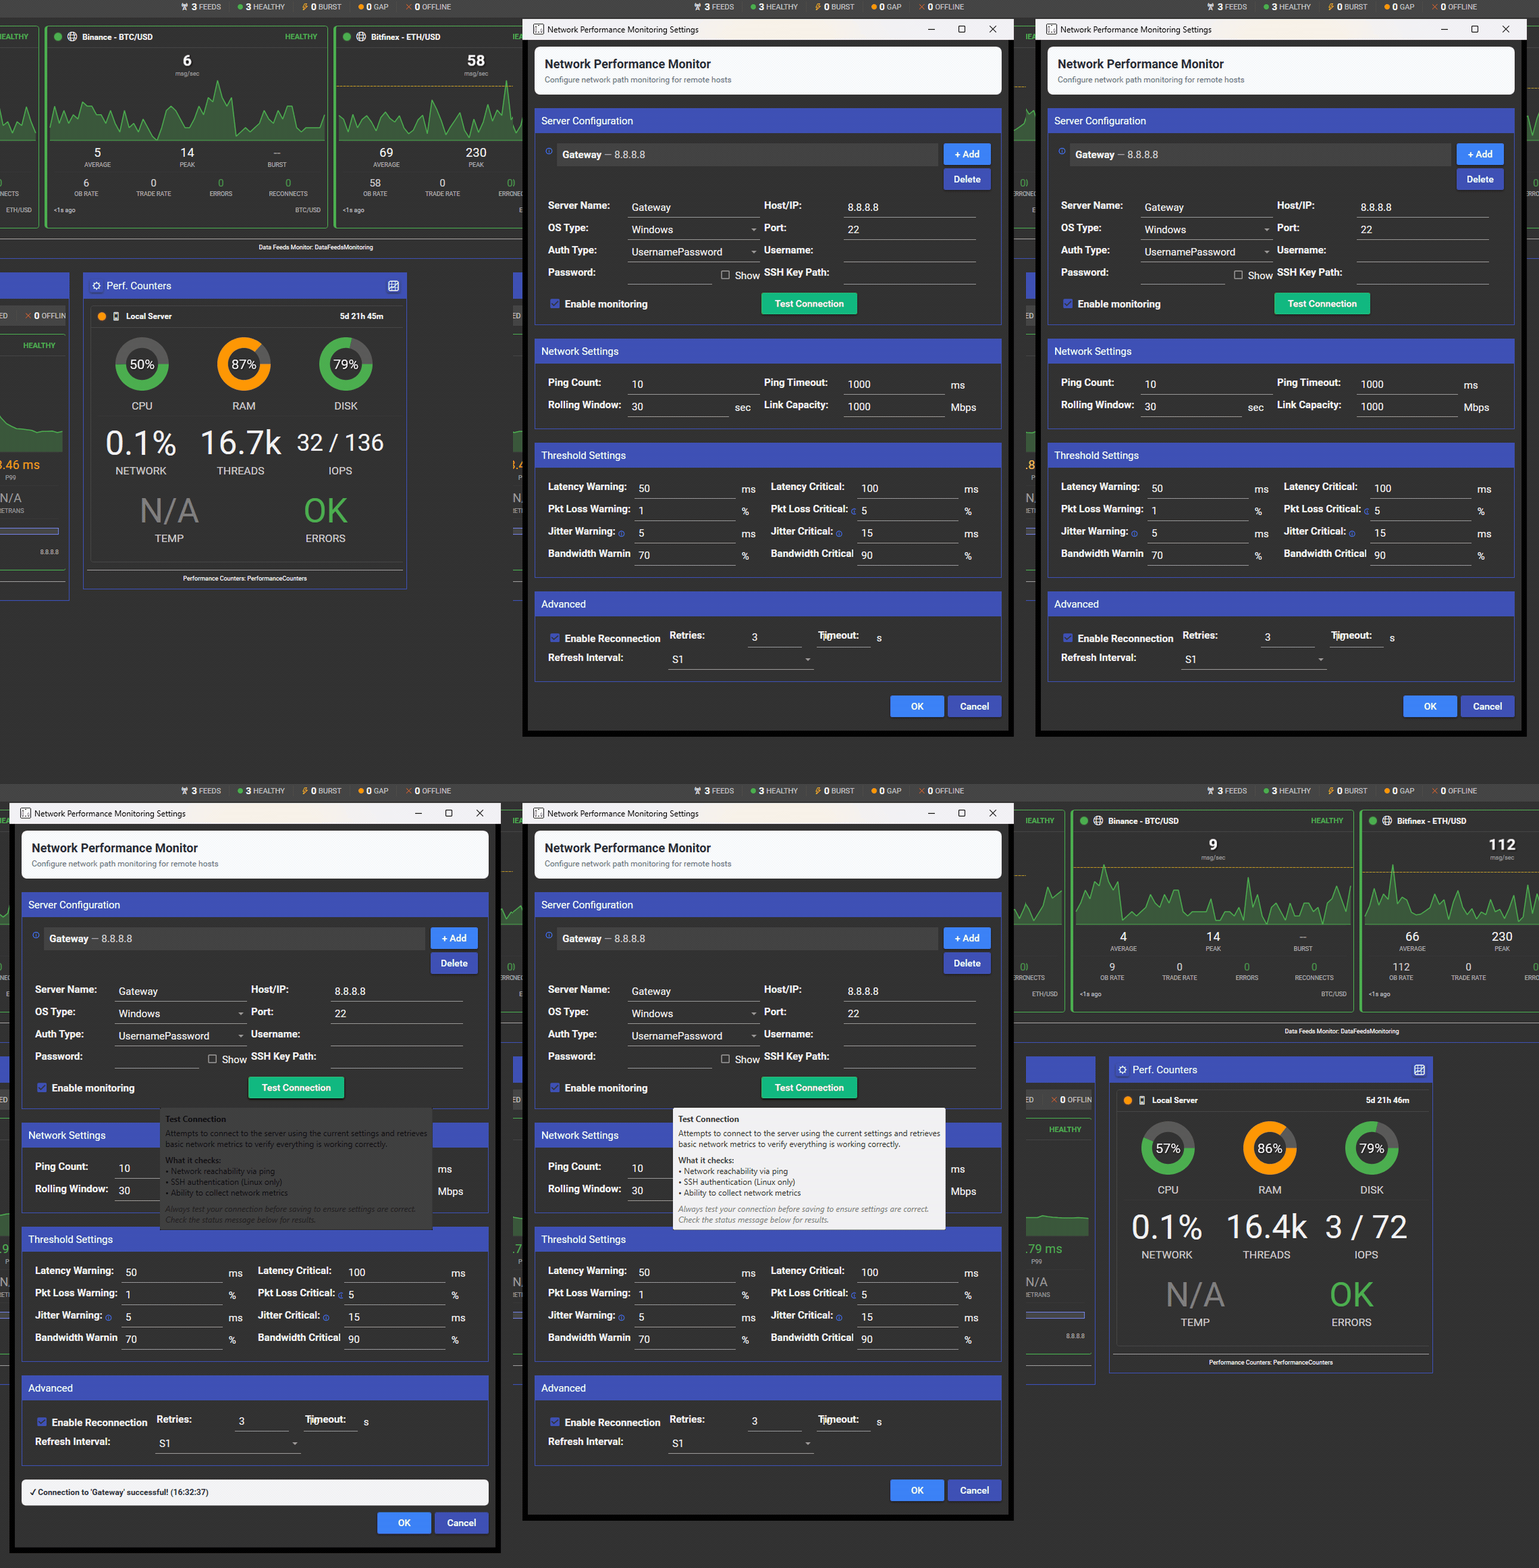
The server list under Server Configuration at the top of the dialog is every host this plugin watches; its ⓘ explains it. Use + Add for a new one and Delete to remove the selected one; the fields underneath edit whichever server is selected. Watch as many hosts as you need: your exchange gateway, your colocated box, your VPN endpoint, each on its own card.
The list starts with 8.8.8.8 under the name Gateway, so the tile is alive on first run
(NetworkPerformancePlugin.cs:140-152). Replace it with the address that matters to you.
| Setting in the dialog | Default | Effect |
|---|---|---|
| Ping Count | 10 | Probes sent per collection cycle. Every one is a sample in the percentile window, so a higher count buys resolution at the cost of traffic. Clamped to 1 to 100 |
| Ping Timeout | 1000 ms | How long a single probe may take before it counts as lost. Clamped to 100 to 10,000 ms |
| Rolling Window | 30 s | How far back the percentiles look, in time. Accepts 10 to 300 seconds |
| Link Capacity | 1000 Mbps | The denominator for the bandwidth percentage. Set it to your link’s rated speed so the bar reads as true utilisation |
| Latency Warning / Critical | 50 / 100 ms | Colours the P50 metric and the card, and the critical value raises the plugin’s own alert |
| Pkt Loss Warning / Critical | 1 / 5 % | Colours the loss metric and the card, and the critical value raises the plugin’s own alert |
| Jitter Warning / Critical | 5 / 15 ms | Colours the jitter metric and the card. Jitter between the two yields Warning |
| Bandwidth Warning / Critical | 70 / 90 % | Colours the bandwidth metric and the card |
| Refresh Interval | S1, so one second | How often the host is probed. S1, S3, S5 and D1 map to 1, 3, 5 and 60 seconds (Studies.NetworkPerformance/Models/PlugInSettings.cs → RefreshIntervalSeconds) |
Each of the four measurements is graded by the same warning and critical pair everywhere it appears: the colour of the card, the colour of the published metric, and the alert. Set the pair once and the whole plugin agrees with itself.
Test Connection checks the server currently selected in the list, which is the fastest way to
confirm you typed a host correctly before you add the next one. For a Windows target it sends one
ICMP ping with a three-second timeout; for a Linux target it opens an SSH session and runs
echo ok with a five-second command timeout. Either way the result appears in the dialog with a
timestamp.
Network metrics published for alerting
Seven metrics per host per cycle, tagged {ServerName} - {Metric}: Latency P50, Latency P95,
Latency P99, Packet Loss, Jitter, Retransmits/s and Bandwidth Util
(NetworkPerformancePlugin.cs:388-405). Loss, jitter and bandwidth carry the colour their
thresholds imply, so a rule and the card cannot disagree.
The plugin also raises its own alert event whenever P50 exceeds the critical latency threshold or loss exceeds the critical loss threshold.
Performance Counters Remote Servers
Watches the health of machines rather than links. It uses the same server model as Network
Performance, sharing the ServerInfo type, so a host you describe in one is described the same way
in the other.
Why watch the host
Hosts fail in ways that arrive disguised as market problems. Memory creeping up overnight, a disk
quietly filling, a CPU pinned by something that is not you: each of those shows first as latency you
will spend an hour blaming on a venue. Watching the box alongside the feed means you rule it in or
out immediately. It also reaches machines you are not sitting at, so a colocated box with no screen
attached still reports, though it ships pointed at localhost
(PerformanceCountersPlugin.cs:136-142) and you point it elsewhere yourself.
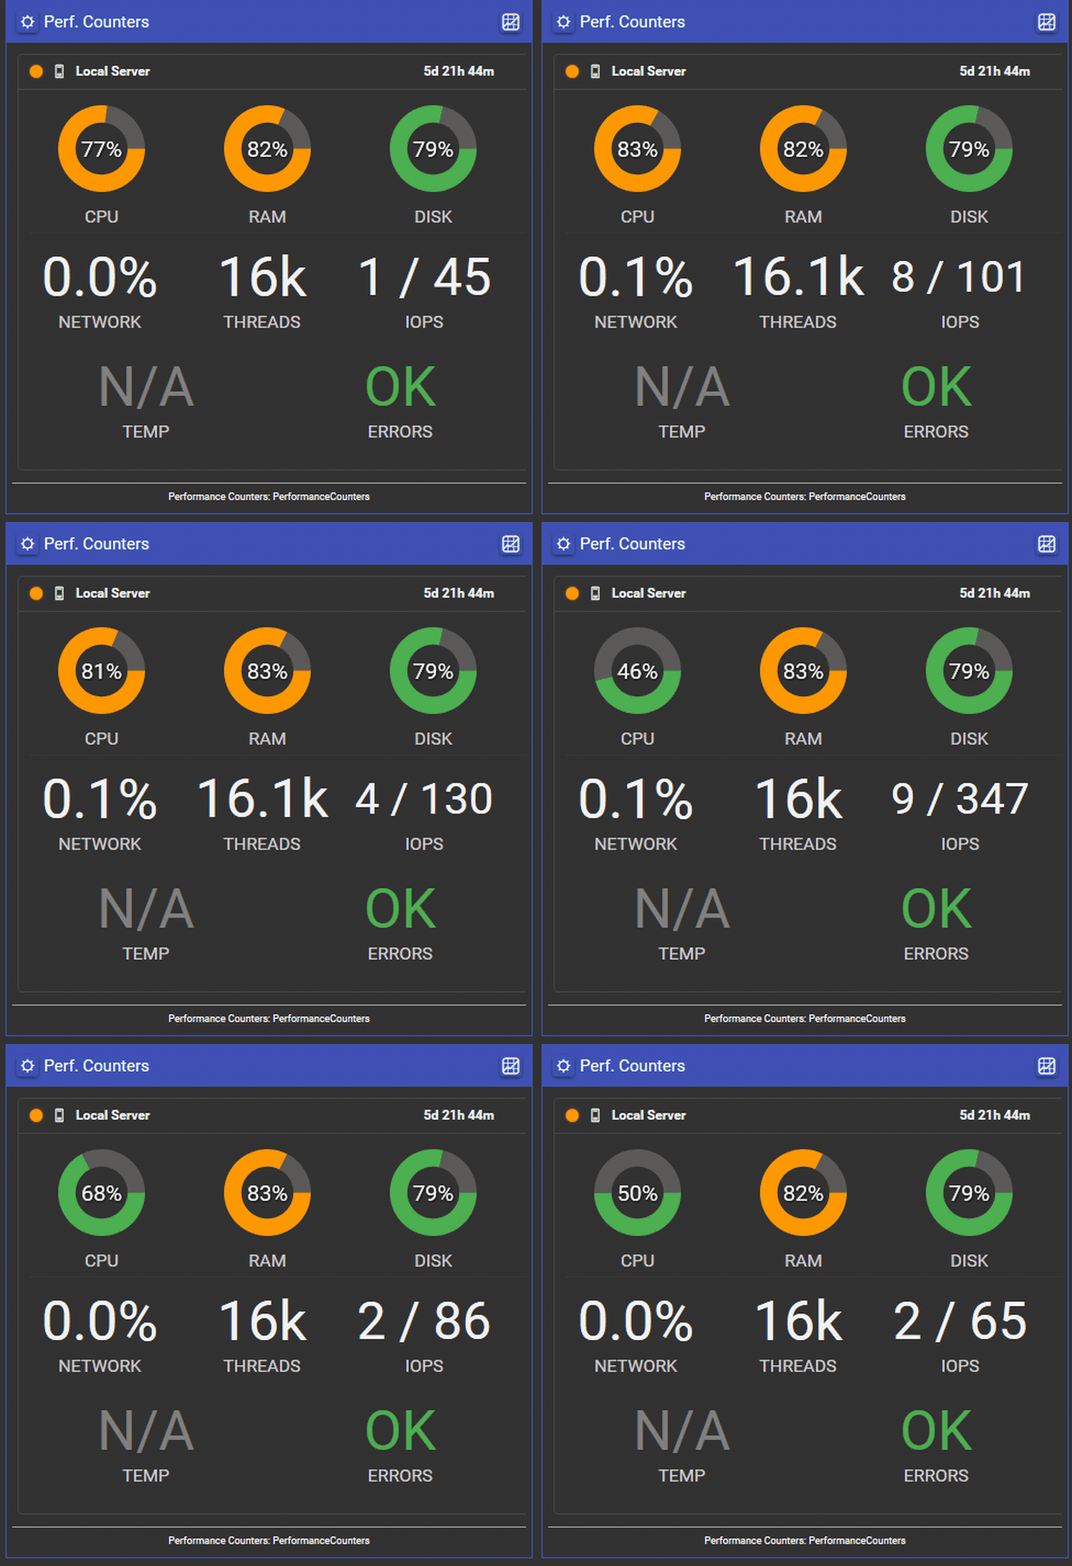
What a server card measures
| Card field | Source on Windows | Source on Linux |
|---|---|---|
CPU | Processor \ % Processor Time (_Total) | /proc/stat, sampled twice for a delta |
RAM | Memory \ Available MBytes and Committed Bytes | /proc/meminfo |
DISK | LogicalDisk \ % Free Space on the detected system drive | stat -f / block and fragment counts on the root filesystem |
NETWORK | Network Interface \ Bytes Total/sec against Current Bandwidth | /proc/net/dev, sampled twice |
THREADS | System \ Threads | /proc/loadavg |
IOPS | PhysicalDisk \ Disk Reads/sec and Disk Writes/sec | /proc/diskstats, sampled twice |
| TCP connections | TCPv4 \ Connections Established | /proc/net/tcp |
| Uptime | System \ System Up Time | /proc/uptime |
TEMP | WMI MSAcpi_ThermalZoneTemperature against that server’s own thermal zone, where the host exposes a sensor (Providers/WindowsPerformanceProvider.cs:643-646) | /sys/class/thermal |
ERRORS | Recent hardware entries in the Windows System event log | Script warning and error counts |
The Linux collector is one SSH round trip per cycle running a single script
(Providers/LinuxPerformanceProvider.cs). Every block in that script is individually guarded with a
readability check, so a hardened host that restricts /proc/diskstats still returns every other
metric in the cycle.
Configuring a monitored server
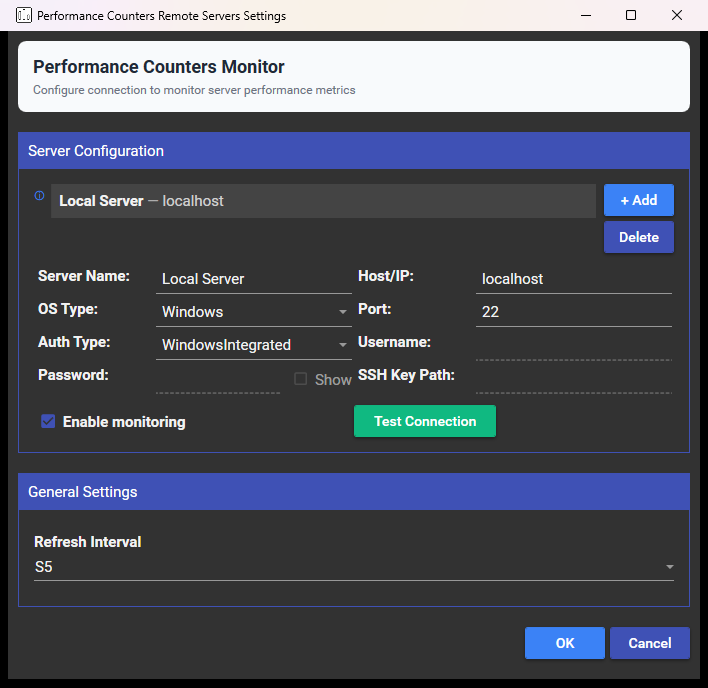
This dialog carries the same Server Configuration list as Network Performance, with the same + Add and Delete controls, so a fleet of hosts is built the same way in both plugins.
The default refresh interval is five seconds (AggregationLevel.S5), a slower cadence than Network
Performance because host counters move slowly and a light touch on the target is the right default.
How authentication works:
- For a Linux target,
Username,Password,PortandSSH Key Pathare used, by SSH.NET, exactly as you would expect. Prefer SSHKey authentication. - For a Windows target,
Username,PasswordandSSH Key Pathare disabled in this dialog, each with a tooltip saying why (Portstays editable but is unused). Remote performance counters, WMI and the event log are read as the Windows identity VisualHFT is running under, so there is nothing to type. To monitor a remote Windows host, give that account access on the target, run the Remote Registry service there, and make RPC reachable. The Network Performance dialog does not grey those fields out, so ignore them there on a Windows target too.
Passwords are encrypted before they are written to disk, and the encryption is tied to the machine and the account that wrote them, so restore your settings on the same Windows account and machine. On Linux targets, SSH key authentication is the stronger option: point SSH Key Path at your key and leave the password field empty.
Server metrics published for alerting
Thirteen metrics per server per cycle, tagged {ServerName} - {Metric}: CPU Usage,
Memory Usage, Memory Available, Disk Usage, Disk Free Space, Network Utilization,
Network Bytes/Sec, Thread Count, Disk Read Ops/Sec, Disk Write Ops/Sec, TCP Connections,
Uptime Minutes and Hardware Errors (PerformanceCountersPlugin.cs:301-317). A fourteenth,
CPU Temperature, is emitted on hosts that expose a thermal sensor. Most virtualised and cloud
hosts do not, and the tile tooltip says so when it reads N/A, so check there before building a
rule on it.
Market Event Stats
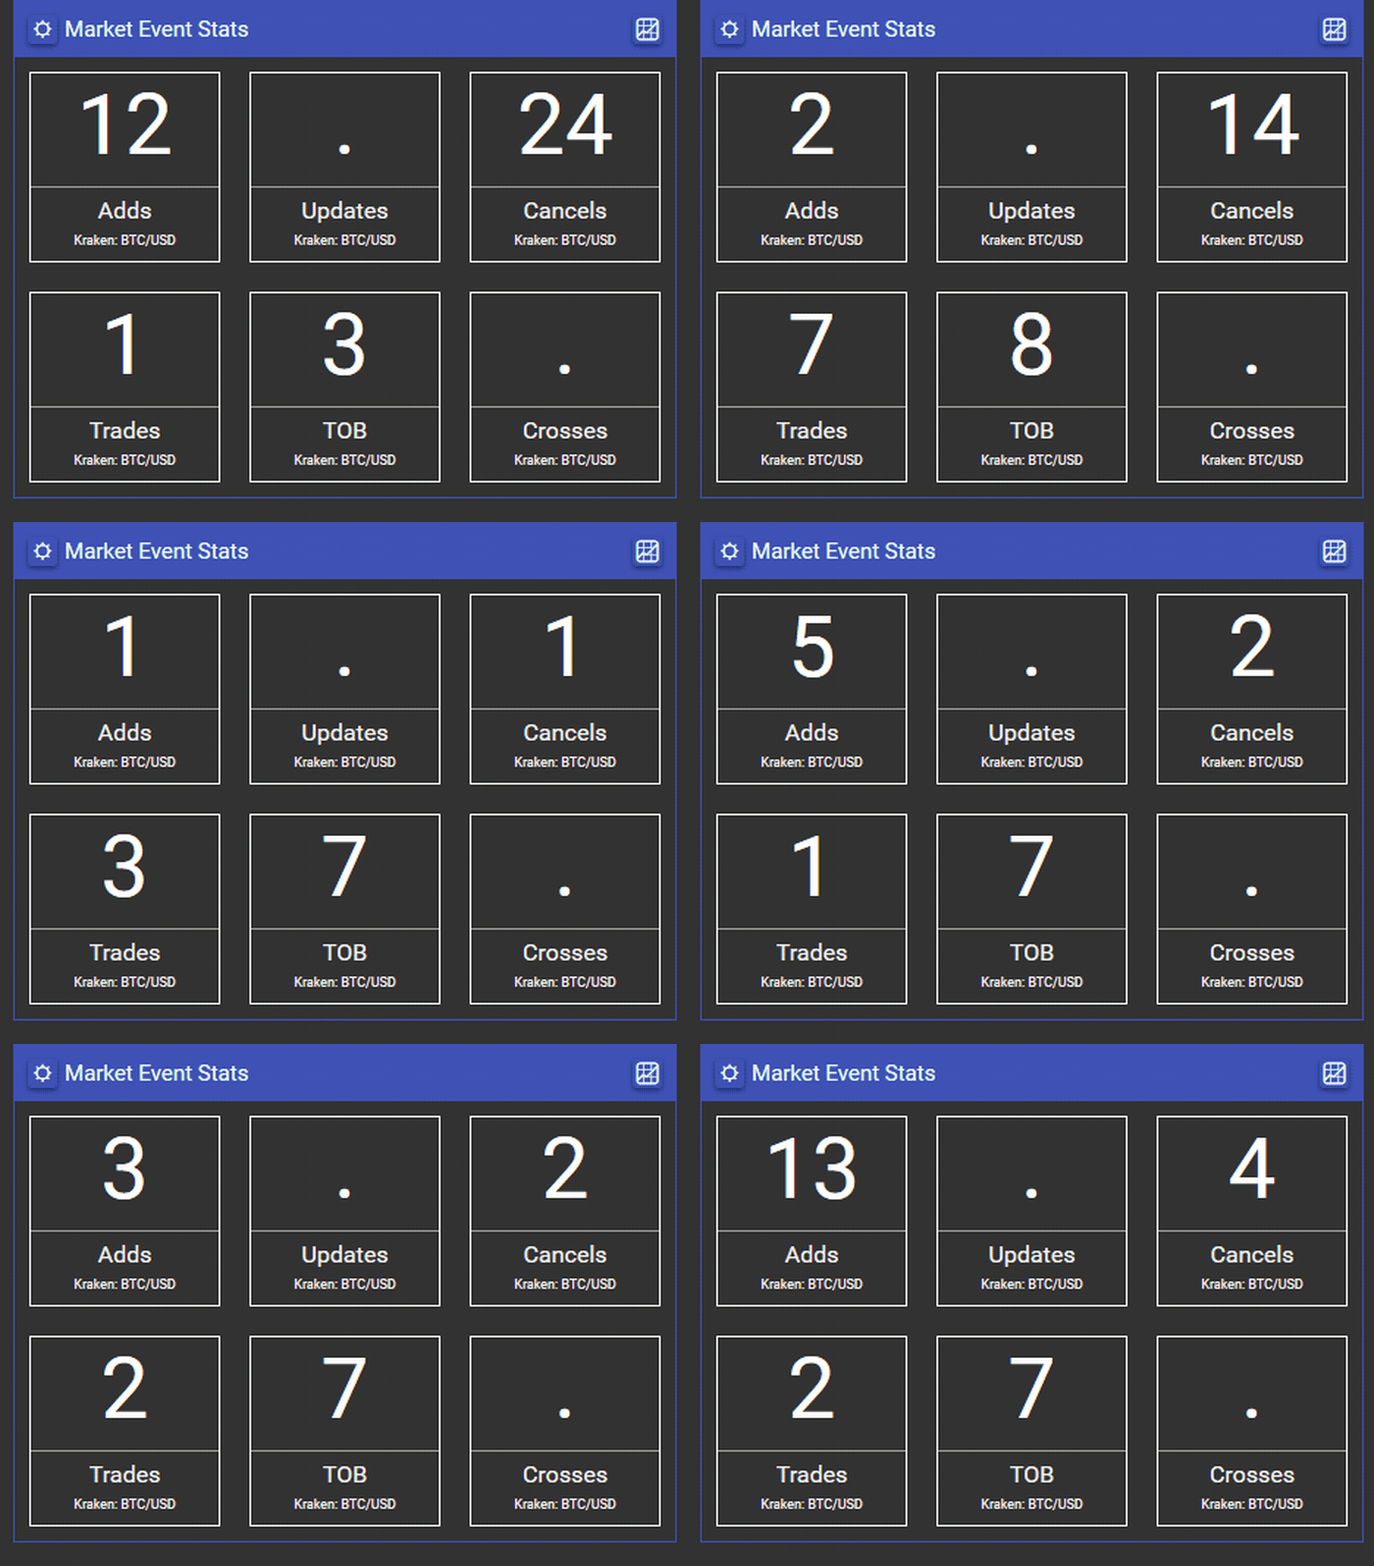
Six counters for one venue and one symbol: Adds, Updates, Cancels, Trades, TOB,
Crosses. It is filed under market microstructure in the catalog, but it sits on this dashboard
because event rates are the fastest way to see that a book has gone quiet or gone haywire.
Why watch event rates
Data Feeds Monitoring tells you messages are arriving. This tells you what kind, and the
difference matters. A book can be extremely busy and contain almost no trades: heavy Adds and
Cancels with Trades near zero is a market quoting at you rather than dealing with you. A sudden
collapse in TOB while Adds and Cancels hold means all the churn is happening away from the
touch. That is often just a quiet top of book rather than a fault, so check it against Crosses and
the feed card before treating it as a stale book.
Crosses is the one to alert on outright. A crossed book, best bid above best ask, is not a market
condition you trade: it means the book in memory is not a faithful picture of the venue, whether
from a dropped delta, an out-of-order frame or a resync you missed. Any sustained non-zero reading
is a correctness problem, not a market one.
It adapts to the depth of data the venue sends
The plugin starts by counting order events directly from the venue’s order-by-order stream. If no
order-level evidence arrives for the ten-second identification window, it switches to deriving the
same counters from the book’s own price-level deltas, and it switches back the moment genuine
order-level data reappears (Model/LobModeDetector.cs:19, window set at
MarketDataStatsStudies.cs:121). A venue that sends full depth is counted
directly for as long as it keeps sending it.
The identification window is not dead time. Price-level deltas seen during it are accumulated,
bucketed at the aggregation level you selected, and replayed when the switch happens
(Model/L2DeltaAccumulator.cs:17), so the first ten seconds on a price-level venue reports real
numbers rather than zeros. Only one of the two paths counts any given event, so nothing is counted
twice across the switch.
In price-level mode:
Adds,UpdatesandCancelsare deltas of the order book’s own cumulative counters between consecutive updates.TOBcounts updates where the best bid or best ask changed in price or size.Crossescounts updates where the spread went negative.Tradescomes from the trade stream in both modes, so it is the one counter that is never derived.
Configuring Market Event Stats
Provider, symbol and aggregation. This is the only one of the three counter groups with a symbol picker, because it genuinely is a per-instrument measurement.
Market Latencies Stats
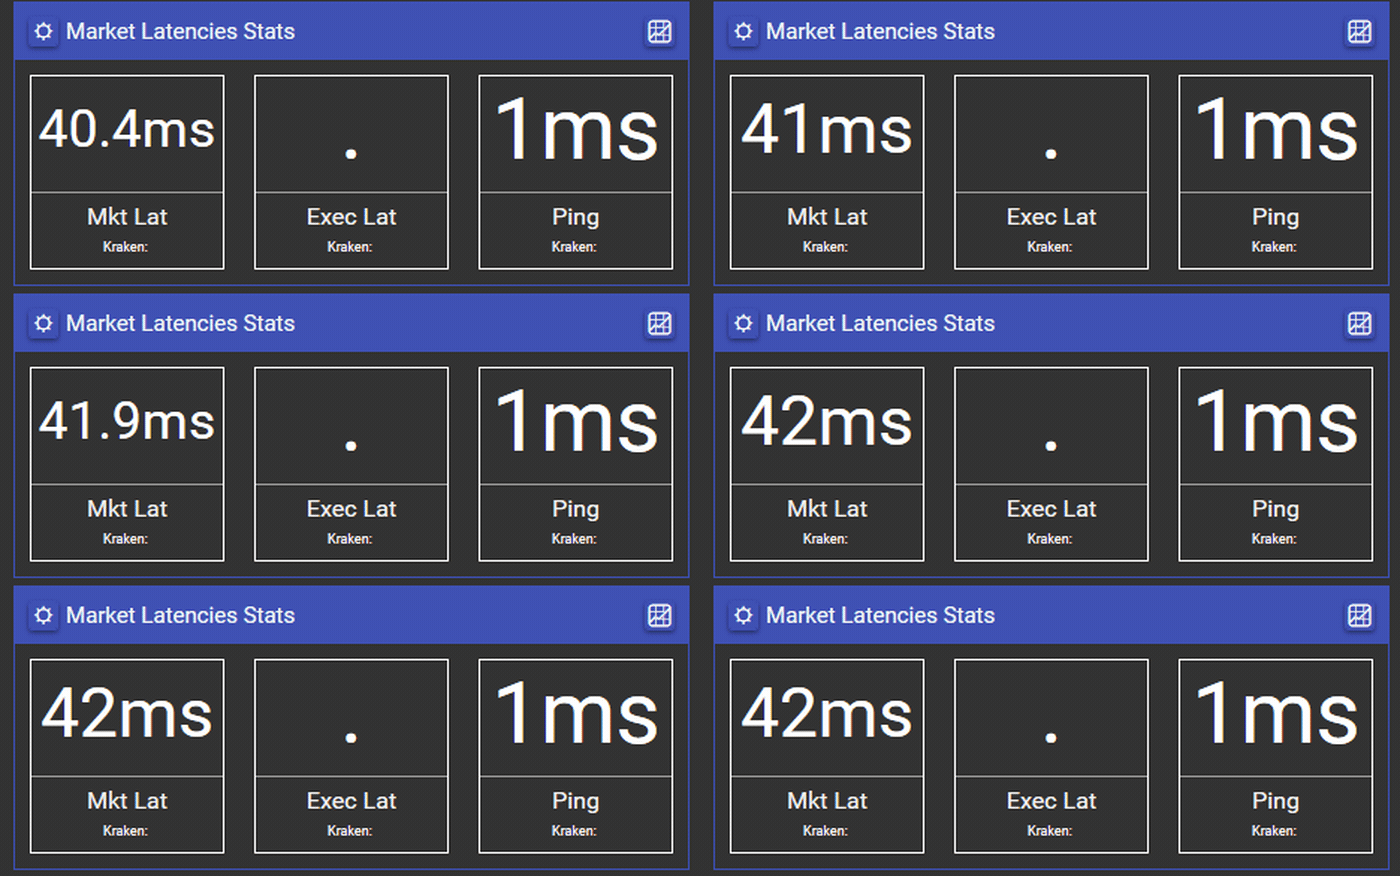
Three counters for one venue: Mkt Lat, Exec Lat, Ping. Each answers a different question, and
this section says exactly which.
Why watch latency
Everything you decide is based on a book that was true a moment ago. Mkt Lat is how long ago.
That single number decides whether a signal is actionable or already history, and it is the one
figure on this dashboard that comes from the venue’s own clock rather than from anything
VisualHFT measures about itself.
Read it next to Ping, but know what Ping is: an HTTPS request to the venue’s REST endpoint
every few seconds (BinancePlugin.cs:780-786). It therefore mixes network round trip with the
venue’s REST-side handling, and it travels a different path from the market-data socket that
Mkt Lat describes. When Ping holds steady and Mkt Lat climbs, the market-data side is falling
behind. When both climb, use Latency P99 from Network Performance against that venue’s gateway to
decide whether it is your path or the venue.
How to read Mkt Lat
Mkt Lat is computed centrally as now - orderBook.LastUpdated, floored at one microsecond
(VisualHFT.Commons/PluginManager/BasePluginDataRetriever.cs:111-115, 131), where LastUpdated is
the venue’s own event timestamp, carried through from the book stream. The floor matters when
you read the tile: a venue whose clock runs ahead of yours shows a flat 1µs rather than a negative
figure, and that reading means “clock skew”, not “instant”.
Six of the seven shipping connectors deliver one. Five of them resolve it at a single decision
point that returns nothing when the frame carries no timestamp, rather than substituting the
local clock, so the number on the tile is never VisualHFT’s decode delay wearing the venue’s name.
BitStamp reads its microtimestamp inline without that guard.
| Connector | Field carried through | Resolved at |
|---|---|---|
| Binance | The event time, E | BinancePlugin.cs → ResolveBookTimestamp |
| Bitfinex | DataTime, via the TIMESTAMP configuration flag | BitfinexPlugin.cs → ResolveBookTimestamp |
| BitStamp | The payload microtimestamp, read inline | BitStampPlugin.cs, in the book handler; no shared resolver |
| Coinbase | The per-entry event_time | MarketConnectors.Coinbase/CoinbasePlugin.cs → ResolveBookTimestamp |
| Kraken | The book v2 timestamp | KrakenPlugin.cs → ResolveBookTimestamp |
| KuCoin | time | KuCoinPlugin.cs → ResolveBookTimestamp |
| Gemini | None. The feed carries no timestamp, so no Mkt Lat is produced. The book is stamped with local time on arrival, and there is no resolver to guard | GeminiPlugin.cs, book update path |
So Mkt Lat reads as the age of the book in front of you, measured on the venue’s clock. Two
consequences worth holding on to. It includes the offset between your clock and the venue’s, which
is why the absolute figure differs between venues that are genuinely equidistant. And on the five
guarded connectors a frame without a timestamp produces no sample at all rather than a fabricated
one (BasePluginDataRetriever.cs:111-115), so the counter holds its last reading instead of
spiking. A briefly static Mkt Lat is that, not a stalled feed: use the Data Feeds card to tell the
two apart.
Read it as a trend on one venue: what matters is how the current figure compares with that venue’s own normal range, which is what tells you its path has changed.
Ping
Round-trip time to the venue, measured and reported by the connector itself, not by this plugin. It is available on Binance, Bitfinex, Coinbase, Kraken and KuCoin.
Exec Lat
Time from order creation to execution confirmation, emitted on the executed-order path
(BasePluginDataRetriever.cs:165-173). It reports on your own orders, so connect the venue with
API keys to see it: a market-data-only session has no order flow to time.
Configuring Market Latencies Stats
Provider and aggregation only. The study matches on provider, so its figures cover the whole venue
(MarketDataStatsLatencies.cs:90-97). There is no symbol picker in this dialog, which is the
visible consequence of that.
Market Operational Ratios
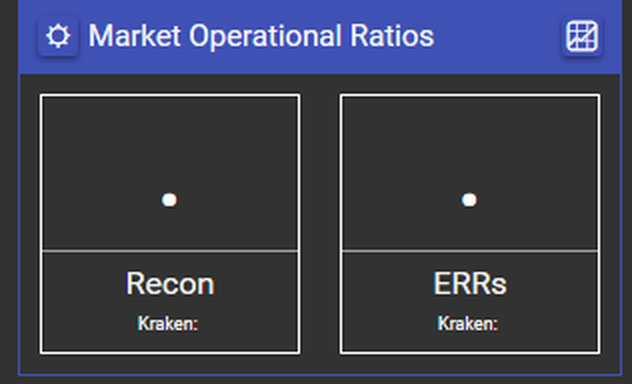
Two counters for one venue: Recon and ERRs. Both come from the connector base class, so every
shipping connector feeds them without any per-connector work.
Why watch errors and reconnections
This is the only tile here whose healthy state is no movement at all, which is exactly why it is easy to forget and worth an alert rather than a glance. A still tile is good news. There is no animation of it working because working looks like nothing happening.
Its value is diagnostic rather than continuous. When a feed degrades, these two counters tell you
which kind of failure you are looking at. A rising Recon with a flat message rate means the venue
is dropping or refusing your session and the connector is fighting to get back in: that is a venue
or credentials problem. ERRs counts every exception the connector logs, transport faults,
queue faults, failed pings and deserialisation problems alike
(BasePluginDataRetriever.cs:442-461), and most of those also trigger a reconnect, so the two
usually move together. The informative case is ERRs rising without Recon: that narrows it to
a non-fatal error, often a message the connector could not read, which corrupts a book quietly
rather than stopping it. Both flat while a feed gaps points away from the connector entirely, at the
network or the venue simply having gone quiet.
ERRsincrements once for every exception a connector routes throughLogException(BasePluginDataRetriever.cs:442-461). That covers API failures, deserialisation problems and unexpected exceptions in the connector.Reconincrements once per reconnection attempt inside the connector’s exponential-backoff loop, after its backoff delay has elapsed and immediately before the reconnect is attempted (BasePluginDataRetriever.cs:358-372). The backoff is2^attemptseconds plus up to one second of jitter, so a risingReconwith a flat message rate means the venue is refusing you, not that the network is slow.
Configuring Market Operational Ratios
Provider and aggregation only, like Market Latencies Stats: both report venue-wide.
A dot on both is the healthy state: neither counter has had anything to report. Any reading at all is worth correlating against the same venue’s card in Data Feeds Monitoring: errors with a healthy message rate usually mean a malformed message type, while errors with a gap usually mean the socket is going down.
What each shipping connector actually feeds
Four of the six plugins read from the venue connector, so what you get depends on which venue you are connected to. This is the complete matrix for the seven venue connectors in the installer, verified against the shipping source. The Aggregator and the Replay Engine ship alongside them but are not venues in their own right.
| Connector | Ping | Recon / ERRs | Trades | Feed rate and gap |
|---|---|---|---|---|
| Binance | Yes | Yes | Yes | Yes |
| Bitfinex | Yes | Yes | Yes | Yes |
| BitStamp | No | Yes | Yes | Yes |
| Coinbase | Yes | Yes | Yes | Yes |
| Gemini | No | Yes | Yes | Yes |
| Kraken | Yes | Yes | Yes | Yes |
| KuCoin | Yes | Yes | Yes | Yes |
Recon, ERRs, Trades, and everything Data Feeds Monitoring measures come from shared paths in
the connector base class or from the order-book and trade streams themselves, so they behave
identically on every venue.
Real situations, and which tile answers them
Six plugins on one screen is only useful if you know which one to read first. These are the situations the dashboard was built around. Each one names what you actually see, what it rules in and out, and the rule worth writing so you are told rather than having to look.
A feed goes quiet, and nothing errors
What you see. One Data Feeds card turns amber, then Degraded, with GAP climbing. The Market
Event Stats counters for that venue stop advancing. Every other card keeps moving.
What it rules out. The other feeds run on the same machine, over the same link, through the same build. If they are healthy, this is not your host, your network or your process. It is that venue.
What to check next. Market Operational Ratios for the same venue. A climbing Recon means the
connector is being dropped and is fighting its way back, which points at the session: credentials,
a rate limit, a venue-side disconnect. Both counters flat means nobody is failing, the venue has
simply stopped publishing.
The rule. Set the plugin’s own Gap threshold above your worst legitimate quiet period first.
The metric reads zero until that threshold is passed and then jumps straight to the elapsed silence
(Helpers/GapDetector.cs:52-67), so a rule value below it changes nothing. Then alert on
Gap Duration Sec CrossesAbove a number at or above that threshold in seconds.
Latency is up: is it them, or is it us?
What you see. Mkt Lat climbing on a venue.
What separates the two. Read it against Ping on the same tile and Latency P99 on the network
card pointed at that venue’s gateway.
Mkt Lat | Ping | Network P99 | Read it as |
|---|---|---|---|
| Up | Flat | Flat | The venue is publishing late. Nothing on your side to fix |
| Up | Up | Up | Your path degraded. The venue is probably fine |
| Up | Flat | P99 up, P50 flat | Intermittent loss rather than a shift. Check Packet Loss and Jitter |
The rule. Latency P99 GreaterThan your critical threshold, with a time window of 10 seconds
so a single bad cycle does not page anyone.
The book is wrong rather than slow
What you see. Crosses reporting at all, or TOB flat while the message rate stays healthy.
What it means. Crosses counts updates where the top of book VisualHFT holds was inverted at
that instant, best bid above best ask (MarketDataStatsStudies.cs:312). It is a test of the local
book, not a comparison against the venue, so read it as this book was momentarily impossible. On a
single venue that is almost always an integrity problem: a dropped delta, a frame applied out of
order, a resync that did not finish. On the Aggregator’s merged book, which publishes under the
Aggregated provider, a cross is a genuine cross-venue condition rather than a fault.
What to check next. ERRs on Market Operational Ratios, read against Recon. ERRs moving on
its own points at messages the connector could not read, which often means the venue changed a
message shape under you. Restarting the connector forces a fresh snapshot and will clear a one-off;
if it comes back, it is not a one-off.
The rule. Crosses GreaterThan 0. This is one of the few counters where any reading at all
deserves attention.
A scheduled event floods the book
What you see. BURST appears on one or more cards, the message rate jumps to a multiple of
AVERAGE, and the sparkline pushes above its dashed threshold line.
What it means. At a release, an auction or an open, this is expected. The useful question is not whether the burst happened but whether you kept up through it.
What to check next. System Diagnosis, and the CPU ring on Performance Counters. If an internal queue grows during the burst and drains afterwards, you absorbed it. If it grows and stays grown, you did not, and everything computed during that window was running behind.
The rule. Burst Magnitude CrossesAbove a multiple you have actually seen survive, not the
default. Watch the tile through one real event first, then set it.
The overnight host failure
What you see. In the morning: feeds gapped, the application unresponsive or gone.
What would have told you. Performance Counters on that host. Memory exhaustion and disks filling are slow, monotonic and completely visible hours before they become an outage, which is what makes them worth a rule rather than a glance.
The rule. Memory Usage CrossesAbove 90 and Disk Usage CrossesAbove 90 on the trading
host, wired to a REST action into whatever pages you. This is the single highest-value rule on the
page, because it is the only one that fires while you are not watching.
Qualifying a venue before you route to it
Connect the venue, add its pairs to Data Feeds Monitoring, point the three counter groups at it, and watch for fifteen minutes of active hours. You are looking for five things:
- The feed card holds Healthy with a message rate that never touches zero.
Mkt Latis stable. Do not judge the absolute figure against the venue’s geography: it carries the offset between your clock and theirs. Judge the spread instead. A number that swings by orders of magnitude is a clock or a path problem, and it will not improve once you are trading.ReconandERRsstay flat. Any reconnection during a quiet qualification window will be worse under load.Crossesnever reports. A dot for the whole window is what you want to see.Tradesis non-zero. A book with quotes and no prints is not a venue you have finished testing.
Check the connector matrix above first: if the venue has no Ping, you are qualifying it without
one of the three latency signals, and Mkt Lat carries more weight.
Turning any of this into an alert
Every metric listed above is published to VisualHFT’s trigger engine, and every one of these six
plugins is offered in the trigger rule picker. Multi-study children appear individually, grouped
under their parent (PluginManager/PluginManager.cs:145-186).
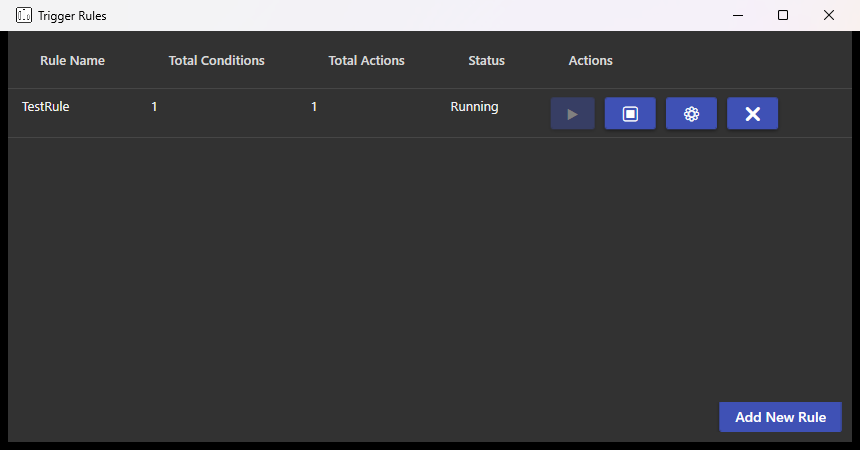
Open Trigger Management from the top bar and press Add New Rule.
Add a condition, then open the plugin list. Every started study that publishes a metric appears here, with its configured provider and symbol underneath the name, and anything not yet configured is greyed out with the reason.
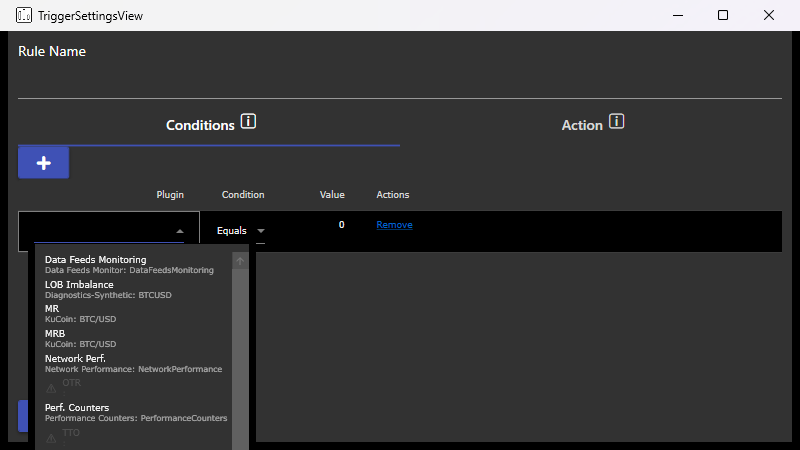
A rule is a when and a then (TriggerEngine/TriggerRule.cs):
- When: a plugin, a metric, an operator and a threshold. Operators are
Equals,GreaterThan,LessThan,CrossesAboveandCrossesBelow(TriggerEngine/TriggerEngineService.cs:392-398). An optional time window turns “above the line” into “above the line for N seconds”, which is what you want for anything noisy. - Then: an in-app alert, or a REST call. The REST action takes a URL, headers and a JSON body
template, and sends them as a POST; the dialog’s own help text says POST is the only method
supported today (
TriggerEngine/Actions/RestApiAction.cs:39). Seven placeholders are substituted before the body is sent (TriggerEngine/TriggerEngineService.cs:450-460):{{rulename}},{{metric}},{{plugin}},{{condition}},{{threshold}},{{value}}and{{timestamp}}. Use{{metric}}for the name of the metric that fired;{{plugin}}resolves to the same value and is kept so that templates written earlier keep rendering identically. The dialog lists all seven. Each action carries its own cooldown, so a flapping condition does not flood your endpoint.
Useful starting rules for an infrastructure desk:
| When | Why |
|---|---|
Gap Duration Sec CrossesAbove 5 on your primary feed | Know the moment a feed goes quiet |
Latency P99 GreaterThan your critical threshold for 10 seconds | Path degradation, not a single bad probe |
Packet Loss CrossesAbove 1 | Loss is almost always a precursor, not an event |
Memory Usage CrossesAbove 90 on the trading host | The classic overnight failure |
Recon GreaterThan 0 | A venue is dropping you |
System Diagnosis is a different tool: VisualHFT watching itself
Everything above this point monitors things outside VisualHFT: venue feeds, network paths, remote servers. System Diagnosis is not part of that. It monitors VisualHFT’s own internal health, the queues and processing stages inside the running application, and it observes nothing outside the process. It is included here only so you do not reach for it expecting an infrastructure monitor.
The monitor icon in the top bar opens it: internal queue depths and processing rates, object-pool
utilisation, per-data-source ingestion counters, and a live log tail, refreshed once per second
(ViewModel/vmSystemDiagnosis.cs:46).
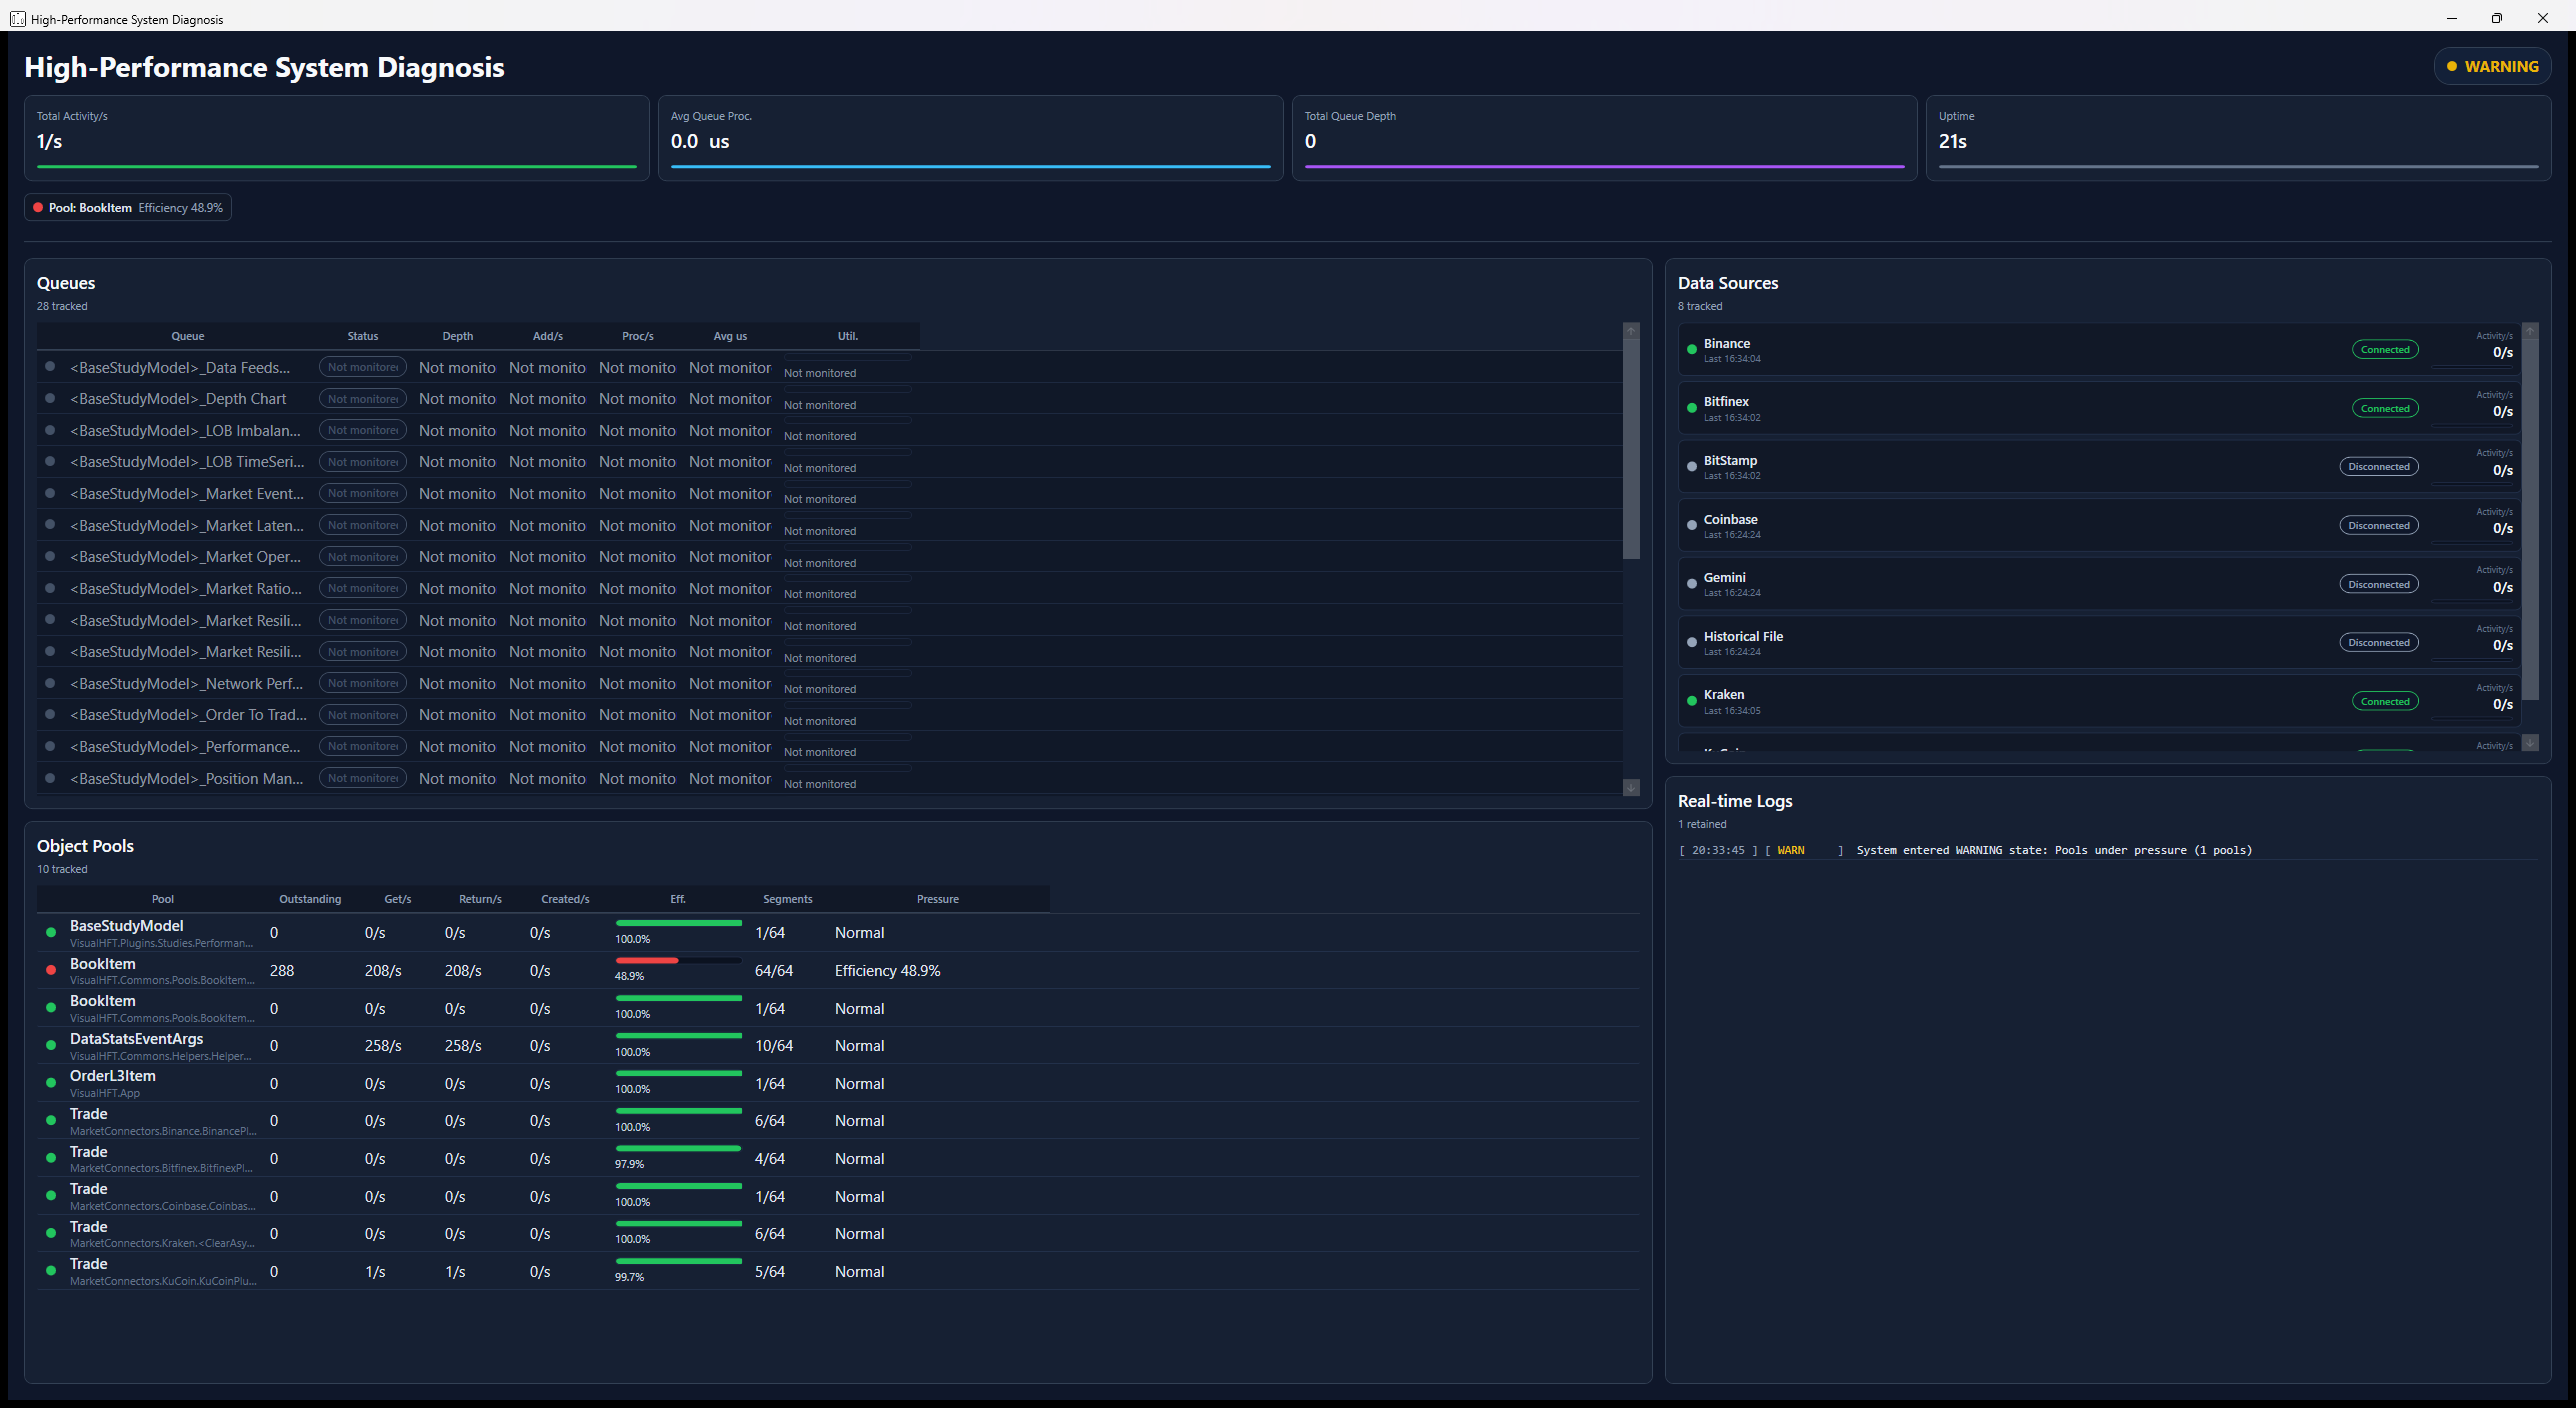
The question it answers is is VisualHFT itself keeping up? A queue that is growing means this application is not draining work as fast as it arrives. That is a different failure from a slow venue or a saturated host, and neither the feed cards nor the server gauges will show it. When a number on the dashboard looks wrong, check here to rule out the application before you go looking at the wire.
In the Queues panel, a queue reports depth and rate when it was constructed with health monitoring on; the rest read Not monitored, which keeps their counters off the hot path where every nanosecond is spoken for. The Data Sources and Object Pools panels are always live.
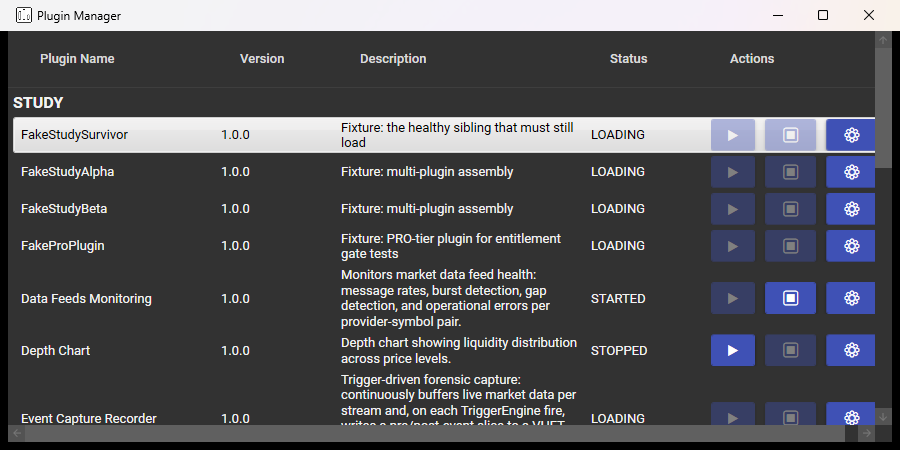
The Plugins Management window in the same top bar is where you start, stop and configure any plugin, including all six on this page, without going through a dashboard tile.
Keeping a history
These plugins report on the running feed in real time. To keep a record, send the metric to your own time-series store with a REST trigger action, or record the session with Session Recorder and replay it whenever you want to look again.
Where the settings live
All plugin settings are stored in a single file:
%LOCALAPPDATA%\VisualHFT.UserData\Settings\settings.jsonEach plugin has its own block keyed by a hash of its identity, and VisualHFT rewrites that block
whenever you press OK in the plugin’s settings dialog. Back the file up to keep your dashboard
configuration, including every monitored server you have added. Restore it on the same Windows
account and machine, because the stored passwords are tied to both.
Related
- Run and operate VisualHFT for the basics of connecting a venue.
- Use your own historical market data for recording and replaying a session.
- Troubleshoot VisualHFT for keeping a venue connection stable.