Guides · 19 min read

How to Use Your Own Historical Market Data in VisualHFT

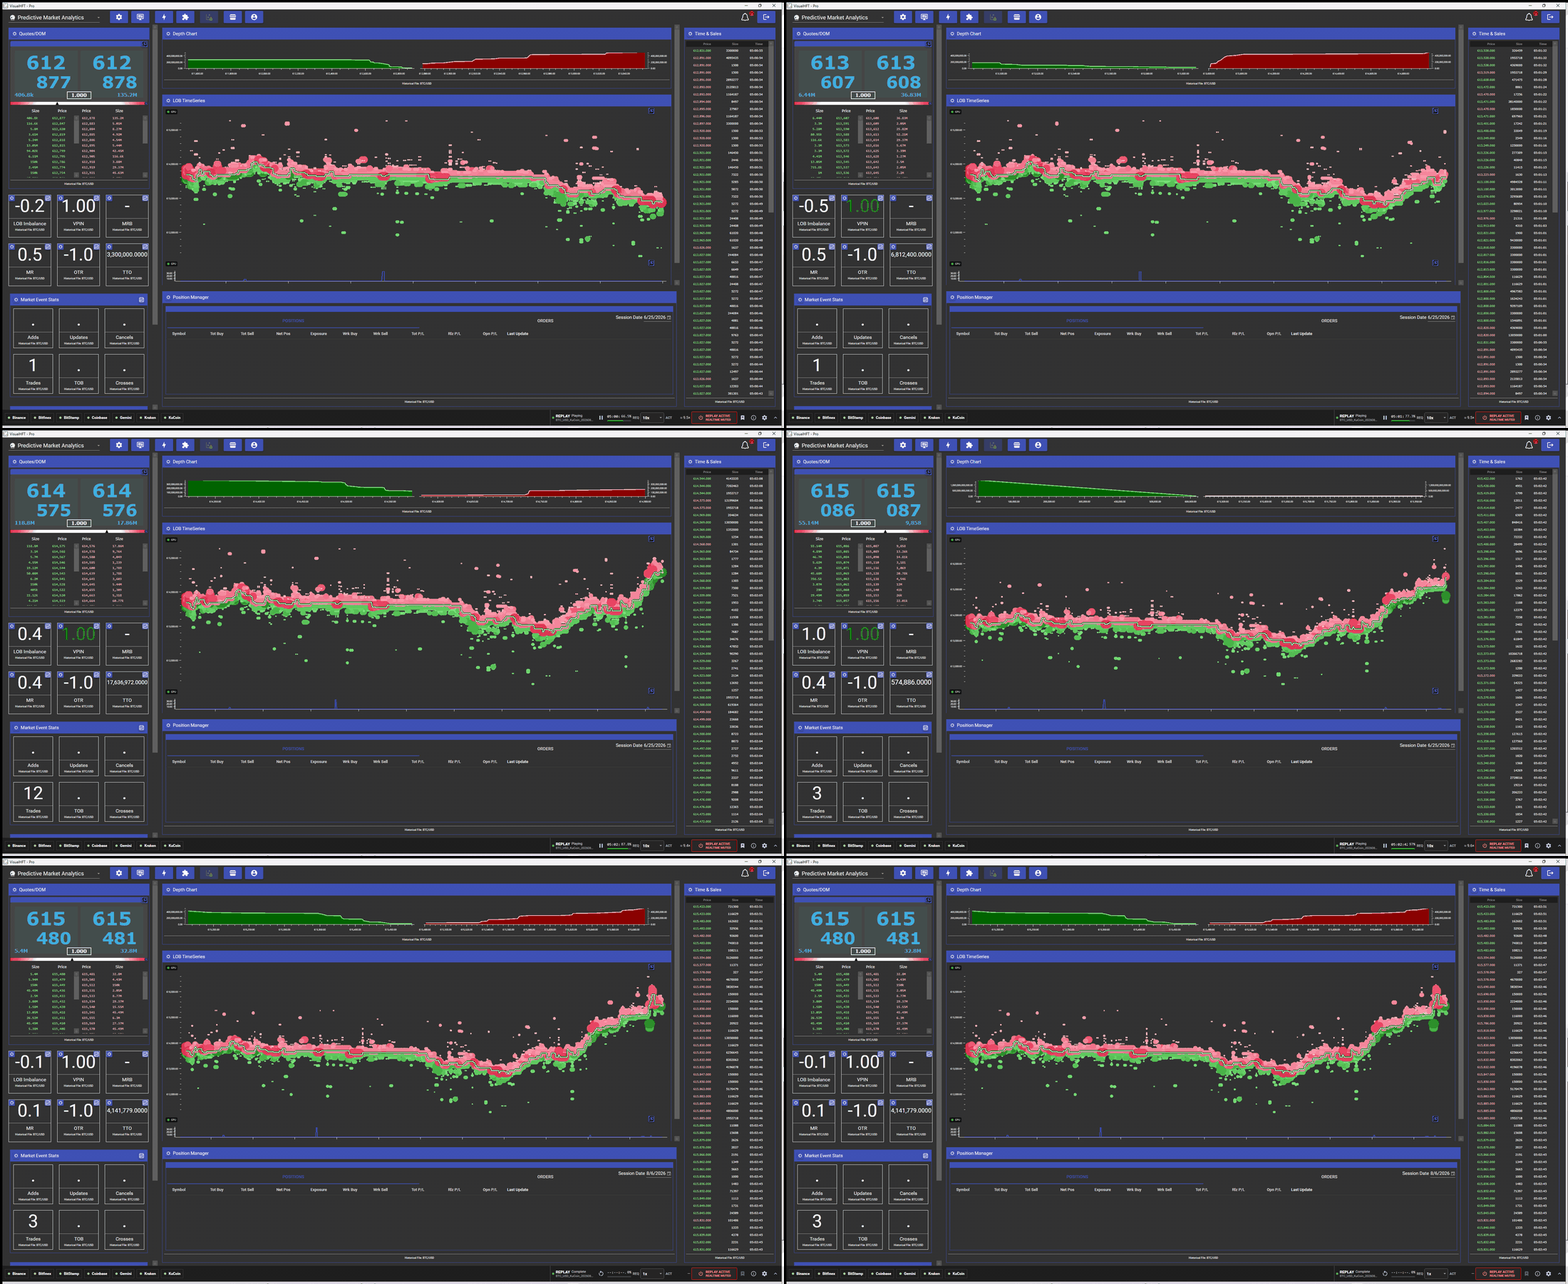
The VisualHFT dashboard replaying a captured BTC/USD order book: full depth, LOB time series, time and sales, and every study tile computing on historical data

Most microstructure tooling has a hard split: one stack for the live feed, another for research on files. The two never agree, because they are two different code paths with two different bugs.

VisualHFT does not have that split. Historical data is re-injected through the byte-for-byte same path a live exchange connector uses. The Replay Engine derives from the same BasePluginDataRetriever base class as the Kraken and Binance connectors, publishes through the same HelperOrderBook and HelperTrade singletons, and reaches every study through the same synchronous dispatch. No study, chart, or view model has a single line of replay-specific code. The only per-message difference is the provider identity stamped on the data: ProviderID = 98, "Historical File".

That one design decision is what makes everything below work. This guide covers what VisualHFT can read today, how to get your own data in, and what you can do with it once it is playing.

The VisualHFT dashboard replaying a captured order book: depth chart, LOB time series with resting-order bubbles, time and sales, and study tiles all computing on historical data

A recorded BTC/USD session replaying at 10x. Every tile is labelled “Historical File: BTC/USD”. Nothing on this dashboard knows the data came from a file.

What VisualHFT Reads Today

Four formats are selectable in the Replay Engine’s format picker. This is the complete list as shipped, not a roadmap.

The Replay Engine format dropdown showing the four selectable capture formats: pcap-TV-NASDAQ-5, FIX 4.2, VHFT-BIN-1 and VHFT-SESS-1

Format stringWhat it isTypical extensionMulti-file support
pcap-TV-NASDAQ-5NASDAQ TotalView-ITCH 5.0 over MoldUDP64, captured to pcap.pcapYes, one whole directory, concatenated in filename order
FIX 4.2FIX 4.2 tag=value text logsany text fileYes, several files merged by timestamp
VHFT-BIN-1VisualHFT’s own binary capture format.vhftbinSingle file
VHFT-SESS-1A Session Recorder session container.vhftsessSingle file, single stream

One caveat worth stating plainly: a fifth format, VHFT-BIN-2 (the L3 message-by-order variant), is registered in the parser factory but is deliberately not offered in the picker. If you see it referenced elsewhere, it is not user-selectable today.

Everything else routes through one of those four, or through a converter you write. Both routes are covered below.

Path A: You Already Have Exchange-Native Captures

If you have NASDAQ TotalView-ITCH 5.0 pcap files, you are done reading formats. Point the engine at them.

Open the Replay Engine settings, pick pcap-TV-NASDAQ-5, tick Is Directory?, and select any file inside the folder. VisualHFT stores the folder, enumerates every *.pcap in it, and plays them as one continuous session.

The Replay Engine Settings dialog showing provider identity 98 "Historical File", the symbol list, depth levels, the format picker and the loaded capture

Three things decide whether an ITCH capture actually produces data, and all three are easy to get wrong:

Symbols must match the ITCH Stock field exactly. The parser is constructed from the symbols you type in the settings dialog. AAPL works. AAPL.US does not.

The first file must carry the StockDirectory messages. ITCH announces each instrument with an 'R' message. Until the parser sees the 'R' for your symbol, nothing downstream registers, and the replay runs to completion emitting nothing. In a full-day capture split into hourly segments, those messages are in the first segment. If you point the engine at a single mid-session file, expect silence.

Directory order is filename order, not timestamp order. The engine sorts *.pcap by name and concatenates. That is correct for session logs written as sequential time segments, which is how these captures are normally chunked. It is wrong if you drop unrelated files with clashing names into the same folder.

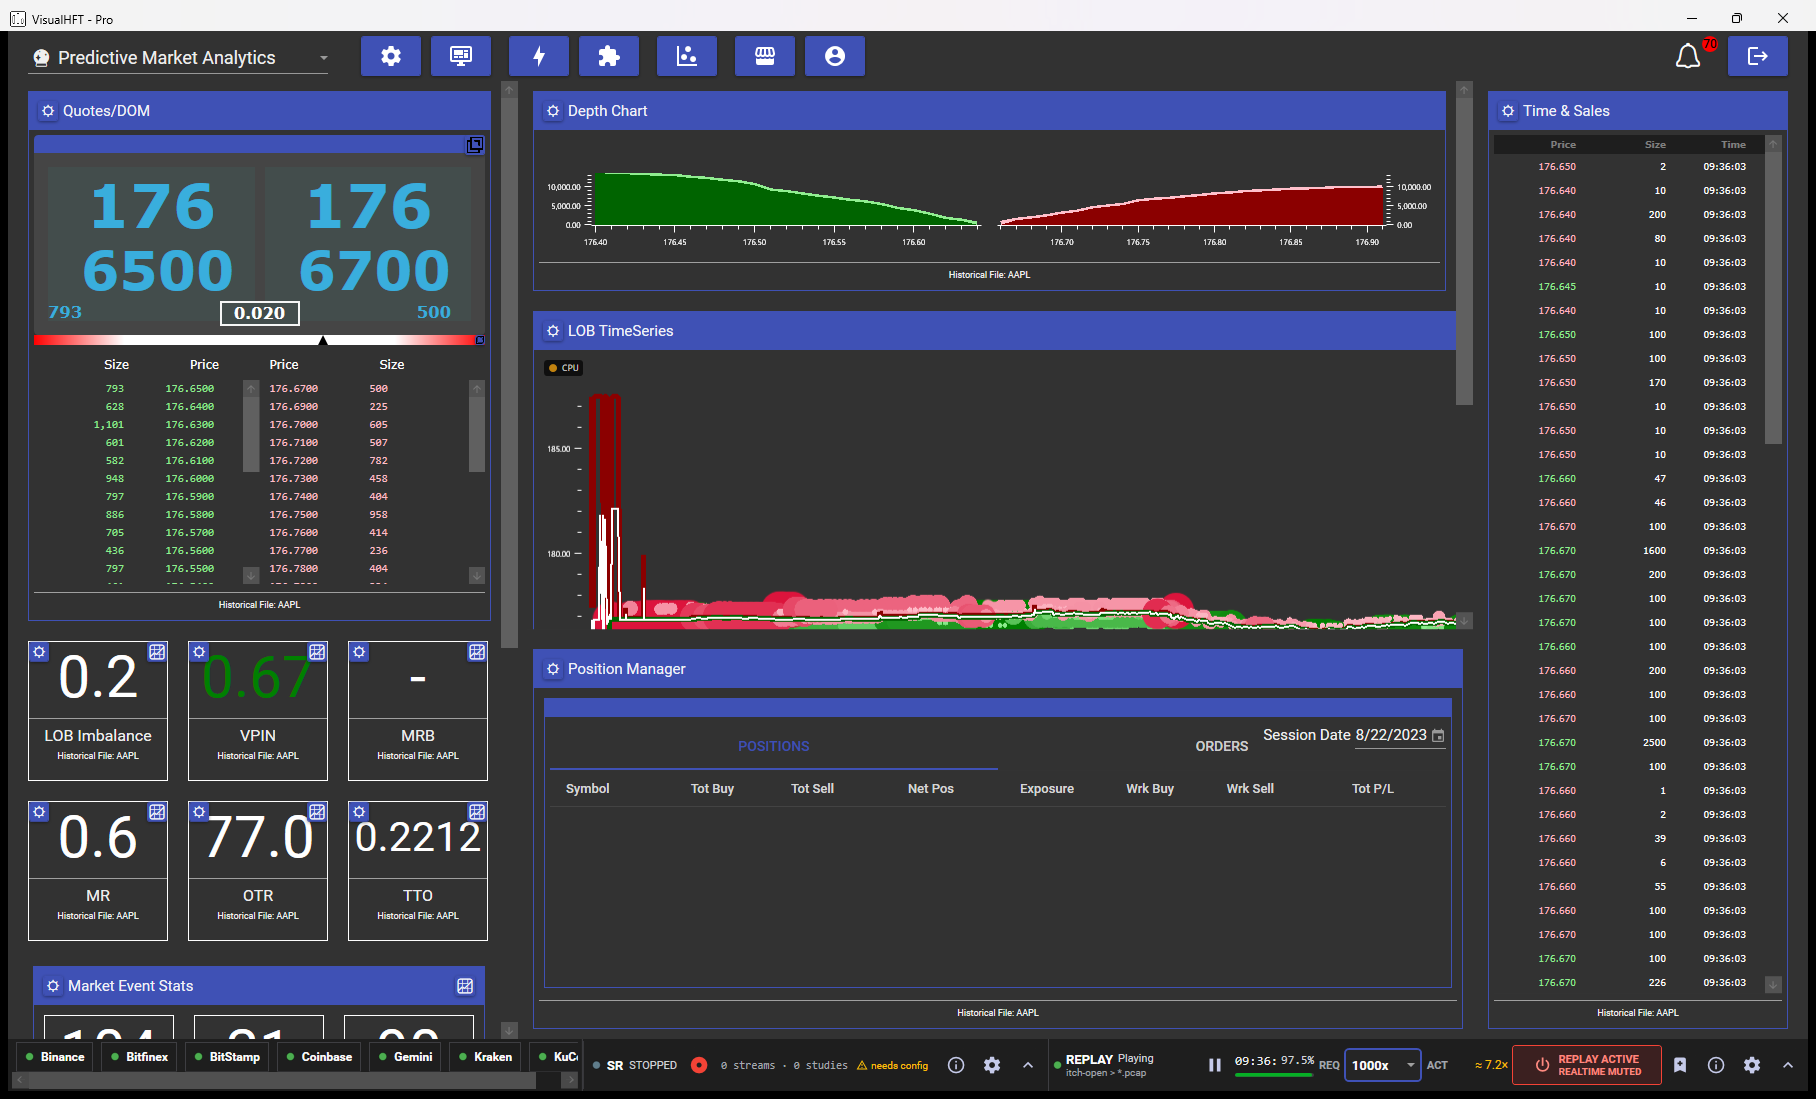
Here is a real 103-file NASDAQ TotalView-ITCH capture loaded and ready, then playing:

The VisualHFT replay console showing a NASDAQ TotalView ITCH capture loaded, state Ready, replay off and realtime on

The same console once replay is engaged: replay active, realtime muted, virtual clock at 20:00:31, achieved speed approximately 1.0x

Note the clock. 20:00:31 is not wall time. It is the capture’s own time, projected onto the session date read from the file. The Position Manager’s session date field flips to the capture date too, in this case 22 August 2023. Every time-dependent study on the dashboard reads that clock, not the system clock.

Path B: FIX 4.2 Text Logs

Select FIX 4.2 and add your log files individually. Unlike pcap, the text path does a real streaming k-way merge across files: it keeps at most one buffered message per file and repeatedly emits the globally earliest timestamp. That is result-equivalent to a global sort as long as each file is internally chronological, at O(number of files) memory instead of O(total messages).

Snapshot, incremental refresh, new order single, execution report and cancel-replace are all handled on this path.

Two practical constraints: all active files must share one extension (the settings dialog blocks a save that mixes them, and the engine re-validates at play time), and a directory feed is a pcap-only feature. FIX files are selected individually.

Path C: Record It Inside VisualHFT

If the data you want does not exist yet, capture it from a live connector and replay it later. VisualHFT ships two recorders, and they write different things for different reasons.

Session Recorder does continuous, session-long capture to a single .vhftsess container. It records full order-book frames and trades across one or more provider/symbol/aggregation streams, plus the decimal-exact value of every study metric you select, recorded on change alongside the raw feed. Sessions land in Documents\VisualHFT\Sessions by default, named from a template. Capture is crash-safe: a write-probe refuses to start when the target is not writable, periodic checkpoint frames keep a torn session partly recoverable, and a disk-full condition finalizes and stops rather than taking the app down.

Event Capture Recorder does trigger-driven forensic capture to .vhftbin (VHFT-BIN-1). It continuously buffers live streams in a ring and, when a TriggerEngine rule fires, writes only the pre/post-event slice. Files land in Documents\VisualHFT\Recordings, named from the template {trigger}_{symbol}_{provider}_{utc:yyyyMMdd-HHmmss}.vhftbin, so the file name tells you which rule produced it and when.

The difference is intent. Session Recorder is “keep everything for this session.” Event Capture Recorder is “keep the sixty seconds around every liquidity shock and throw the rest away.”

One real constraint on the replay side of .vhftsess: multi-stream sessions are rejected today with an explicit error. The reader replays single-stream sessions only. If you record three streams into one session and try to replay it, you get a clear failure, not silent corruption. Record one stream per session if replay is the goal.

Worth knowing about the on-disk shape: the Session Recorder is snapshot-based. It writes a periodic keyframe (discriminator 0x01) on the first frame and every resync interval, and a regular snapshot (0x02) in between, but both carry the complete book. There are no incremental deltas to accumulate. That is stated in the export schema sidecar the exporter emits alongside every export, and it means you can reconstruct the book at any timestamp by taking the latest frame at or before it. No replay state machine required.

Path D: Everything Else, via a Converter

If your data is not ITCH pcap, not FIX 4.2, and not something VisualHFT recorded, the supported route is to convert it to VHFT-BIN-1. The format is small enough to implement in an afternoon in any language.

File layout: a 256-byte header, then a sequence of frames, then a 64-byte footer. Everything is little-endian. All timestamps are nanoseconds since the Unix epoch, as signed 64-bit integers.

Header (256 bytes), the fields that matter:

OffsetSizeField
08Magic, ASCII VHFTBIN1
82FormatMajor (uint16), currently 1
102FormatMinor (uint16), currently 0
124HeaderSize (uint32), 256
168CreatedAtUtcNs (int64)
484ProviderID (int32)
5232Symbol, UTF-8, null-padded
844AggregationLevel (int32)
884PriceDecimalPlaces (int32)
924SizeDecimalPlaces (int32)
968SymbolMultiplier (float64)
1044DepthLevels (int32)

The remaining fields, at offsets 24, 32, 40 and 108 through 195, carry trigger provenance (which rule fired, its pre and post windows, its threshold, and the metric value at fire time) and are only meaningful for Event Capture Recorder output. Leave those zero.

PriceDecimalPlaces and SizeDecimalPlaces are load-bearing. VisualHFT is market-agnostic by design and refuses to assume a tick size, so prices and sizes are stored as scaled integers and recovered as priceTicks / 10^PriceDecimalPlaces and sizeRaw / 10^SizeDecimalPlaces. Get these wrong and your book renders at the wrong order of magnitude.

Book frames, discriminator 0x01 (full snapshot) or 0x02 (delta):

byte    0        discriminator (0x01 or 0x02)
int64   1..8     tsNs          exchange timestamp
int64   9..16    localTsNs     local receive timestamp
uint16  17..18   nAsks
uint16  19..20   nBids
then nAsks levels, then nBids levels, 16 bytes each:
  int64  priceTicks
  int64  sizeRaw

Asks come first, then bids. On a 0x02 delta frame, a level with sizeRaw == 0 is the wire signal for “this level was removed.”

Trade frames, discriminator 0x03, fixed 35 bytes:

byte    0        0x03
int64   1..8     tsNs
int64   9..16    localTsNs
int64   17..24   priceTicks
int64   25..32   sizeRaw
byte    33       side       0 unknown, 1 buy, 2 sell
byte    34       aggressor  0 unknown, 1 buy, 2 sell

Write 0 for anything your source does not tell you. Do not infer an aggressor the source did not provide; VisualHFT records unknown as unknown deliberately, because a fabricated aggressor flag silently corrupts trade classification downstream.

Footer (64 bytes):

byte    0        0xFF
int64   1..8     FrameCount
uint32  9..12    CRC32
bytes   13..63   reserved, zero

The CRC is classical CRC-32 (IEEE 802.3, polynomial 0xEDB88320, reflected input and output, init and xor-out 0xFFFFFFFF) computed over the file from offset 0 through byte 8 of the footer inclusive. In other words, header plus all frames plus the footer’s discriminator and frame count. The CRC field itself and the reserved tail are excluded.

Three behaviours to design against:

  • Bad magic or bad CRC is a hard reject. The parser throws. This is deliberate: silent acceptance of a corrupt capture is worse than a loud failure.
  • A missing or partial footer is treated as truncation, not corruption. The parser emits every frame that decoded cleanly, reports Truncated, and the app shows a warning. Crash-interrupted captures stay useful.
  • A full snapshot must precede any delta. The parser treats a delta arriving before its anchoring snapshot as a corruption signal. Start every file with a 0x01.

That is the whole contract. If your source is a vendor tick store, a kdb table, a Parquet dump, or a proprietary binary feed, a few hundred lines gets you to a .vhftbin that the entire dashboard can read.

Loading It: The Actual Walkthrough

With a file in hand, the workflow is eight steps.

1. Open the Replay Engine settings from the gear icon on the persistent replay console in the shell footer.

2. Set the symbols you want replayed, comma-separated, in the venue’s own notation. BTC/USD for a recorded session, AAPL for ITCH.

3. Pick the format and load the file or directory. The picker narrows by extension for two formats: .pcap for the pcap formats and .vhftsess for sessions. VHFT-BIN-1 and FIX 4.2 open the file dialog unfiltered, so watch what you select. The OK button stays disabled until the configuration is structurally valid, and the reason appears inline next to it. The dialog mirrors the engine’s structural rules (one directory, one extension), so it will not save a mixed-format session. It does not re-check that the files still exist; the engine does that at Play and fails loudly if a capture has moved.

4. Let the symbol catalog scan finish. VHFT-BIN-1 carries a single symbol in a fixed header slot and VHFT-SESS-1 carries a per-stream symbol table in its header, so for both the scan is a header-only read that completes instantly. FIX text pays a full-body scan for tag 55. For pcap there is no deep scanner today, so the catalog comes back empty and Play stays ungated rather than blocked. That is why typing the correct symbol matters most on the ITCH path: nothing will discover it for you.

5. Engage exclusive replay mode with the toggle on the right of the replay console. This is the step people skip, and skipping it is why a replay can show “Playing”, advance the progress bar, and leave every tile empty.

Here is what that toggle actually does. Every study filters incoming events against its own saved provider and symbol, so replay data stamped with provider 98 is silently rejected by a study configured for Kraken. Rather than make you hand-edit every tile, VisualHFT engages the process-wide live mute first, so no live connector can emit into a half-swapped study during the transition, then per plugin clones its settings onto the replay identity, stops it, swaps in the clone, and restarts it. A commit that fails rolls back and releases the mute, so a failure never leaves live stranded dark. On deactivation the originals come back.

The clone is what makes this recoverable. Your original settings object is held by reference for the restore, and the restore path then sweeps the settings dictionary and re-registers the original if a clone leaked in, so replay values do not end up serialized over your real configuration.

If a plugin’s symbol cannot be resolved against the capture, that plugin is simply not routed. It keeps its own identity and receives nothing, rather than being silently pointed at the wrong symbol. The routing chip in the provider bar is where you inspect and fix that.

6. Press Play.

The persistent replay console during playback: state Playing, virtual clock and progress, requested speed 10x, achieved speed approximately 9.5x, replay active and realtime muted

7. Set the speed. Eleven options from -1000x to 1000x. Positive values run faster than real time, 1x is real time, and negative values are slow motion: -10x plays at one tenth speed. Pacing is anchored to an absolute wall-clock target per message rather than sleeping the raw inter-message gap, so per-message processing cost is absorbed into the gap instead of accumulating as drift.

The readout next to the selector is the part worth watching. REQ is what you asked for. ACT is what the chain actually achieved, computed as data-time over wall-time, and it turns amber when the achieved factor falls below 80 percent of the requested one. In the screenshot above, 10x requested and roughly 9.5x achieved. That number is honest, and it is there because the pipeline has a real ceiling: our own instrumentation puts single-threaded ingestion through the order-book maintenance path at roughly 110,000 messages per second. Ask for 1000x on a busy tape and you will not get it. The readout tells you so instead of letting you believe otherwise.

8. Bookmark the moments you care about. The Mark button captures a bookmark at the current virtual timestamp, including enough book state to restore it, so you can re-run the same forty seconds of a liquidity event as many times as you need. How the jump resumes depends on the format: pcap and FIX re-open the producer at the stored byte offset, VHFT-BIN-1 reads its body in one pass so the restored virtual clock is the cut point, and .vhftsess does not support seek in this version. Bookmarks persist per capture in a keyed store under %LocalAppData%\VisualHFT\replay-bookmarks.

What Runs On It

Everything. That is the point of the same-pipeline design, and it is worth being concrete about what “everything” covers.

The LOB time series and depth chart rendering resting-order depth from a replayed capture

The order book view, depth chart, LOB time series, and time and sales all render from replayed data with no configuration beyond the routing step. Study plugins compute normally: LOB Imbalance, VPIN, Market Resilience and its bias variant, order-to-trade and trade-to-order ratios, market event statistics, market ratios, latency statistics. In the dashboard capture at the top of this article, every one of those tiles is computing on file data and labelled Historical File: BTC/USD.

Time-dependent studies stay correct at speed because the virtual clock is advanced to each frame’s timestamp before that frame is dispatched, never after. VPIN’s volume buckets, Market Resilience’s shock timeouts, and every latency statistic read data time. This is tested with a rule that deliberately forbids introducing a mock clock seam, because the whole point is that studies read the same clock in replay as they do live.

TriggerEngine rules fire on replayed data as well. Rule metric closures read plugin settings live at fire time, so a routed study emits under the replay identity and your alerting rules evaluate against the historical tape. That closes the loop: you can validate a rule against last Tuesday’s event before arming it on the live feed.

Getting the Data Back Out

Replay is one direction. The other direction matters just as much for research, and Session Recorder sessions export to CSV or Parquet in three shapes.

Long is a faithful event stream, and it produces three tables plus a schema sidecar: metric values, book levels, and trades. Wide gives one row per book frame with every metric column forward-filled to that frame, plus a per-metric as-of age in milliseconds so you always know how stale a carried-forward value is. WideBook is Wide plus the book itself flattened into columns, bid1..bidN and ask1..askN price and size per frame. That last one is the DeepLOB-style panel: full book state and the feature matrix in one record per timestamp.

Export runs in the app with progress and cancel, and there is a standalone CLI for batch work. Both --format and --shape take comma-separated lists, and every format-by-shape combination is written:

Tools.VhftExport <session.vhftsess> --format csv,parquet --shape long,wide,widebook --out <dir> [--stream <key>] [--depth <N>]

Running that against a real 6.5 MB recorded session produced, from 1,948 book frames and 3,896 metric frames, a long export split across three tables and a WideBook panel whose header reads:

book_ts_ns_utc,bid1_px,bid1_sz,ask1_px,ask1_sz, ... ,bid10_px,bid10_sz,ask10_px,ask10_sz,
value_LOB_Imbalance,asofage_ms_LOB_Imbalance,value_VPIN,asofage_ms_VPIN

That session happened to be one whose recorder was interrupted before it wrote its footer. The exporter detected the truncation, exported the valid prefix, marked the outputs partial in their file names, and recorded the torn byte offset. A crashed capture is still a usable dataset.

Every export ships a JSON schema sidecar next to the data describing column types, fill methods, per-stream precision, and the conventions the reader needs. Two of those conventions are worth repeating because they are the ones that trip people up: metric values are last-observation-carried-forward and never recomputed at export, and when a stream’s precision was not observable the sidecar sets PrecisionUnknown and the price and size columns hold raw integer ticks rather than decimals. The sidecar tells you which case you are in, per stream, so a downstream pipeline can branch on it instead of guessing.

The Honest Limits

A guide that only lists capabilities is a brochure. These are the constraints as they stand today:

  • Directory replay is pcap-only. VHFT-BIN-1 and VHFT-SESS-1 replay a single file; FIX takes several files but selected individually, not as a folder.
  • Multi-stream .vhftsess replay is not supported. It fails loudly. Record one stream per session if you intend to replay it.
  • There is no symbol catalog scanner for pcap. You must know and type your symbols.
  • ITCH captures need their StockDirectory segment. Start the directory from the first segment of the session.
  • Playback speed is capped by the pipeline, not the parser. Our own drill puts ITCH decoding at roughly 0.87 microseconds and 173 bytes per message, against 2.7 to 3.1 microseconds and 464 bytes for the order-book maintenance that follows it. Decoding is about three times cheaper in both time and allocation, so it is never the constraint. Requesting 1000x on dense data will show you an achieved factor well below that, in amber.
  • Exclusive replay mode mutes live feeds process-wide while it is engaged. That is the intended isolation. It is released when you switch the exclusive toggle off, on a fault stop, and on plugin teardown including the finalizer and crash path. A clean Stop or an end-of-file with the toggle still on deliberately keeps the mute engaged, so routing survives transport events and tiles hold their last replayed state.

What You Need

The Replay Engine is bundled with the Pro tier at no additional cost. Session Recorder and Event Capture Recorder are separate paid add-ons, as is Microstructure Diagnostics, the transaction-cost-analysis surface that carries its own ingestion layer for execution logs (FIX, CSV, and JSON or JSONL, with a field-mapping dialog for arbitrary column names and venue presets for common schemas). Microstructure Diagnostics is a different ingest path from the Replay Engine and deserves its own guide.

Two notes on what was verified for this article. The replay half was exercised end to end against the shipping build: the format list, the settings dialog, the routing behaviour, the transport controls, the achieved-speed readout, the virtual clock, and the study tiles are all screenshots from real runs, not mockups, and the export section is real CLI output against a real session file. The recorder and Microstructure Diagnostics sections are described from their shipped source, not from a run.

If you have a tape sitting in a directory somewhere that you have never been able to look at properly, the shortest path is: convert it to VHFT-BIN-1 using the layout above, load it, engage exclusive mode, and press play. The dashboard will not know the difference, which was always the idea.

#VisualHFT #market-microstructure #historical-data #replay #backtesting #ITCH #FIX #order-book