Use your own historical market data
Feed captured market data into VisualHFT Terminal: the four formats the Replay Engine reads, loading a NASDAQ TotalView-ITCH pcap directory, recording your own sessions, writing a converter for any other source, and what the dashboard shows once the tape is playing.
This VisualHFT Terminal Pro workflow feeds captured market data through the Replay Engine, and optionally records your own captures with Session Recorder. Start from Data, storage, and replay for the shorter operating procedure; this page is the full reference, including the capture-format specification and a working converter.
How replay works
Historical data is re-injected through the same path a live exchange connector uses. The Replay
Engine derives from the same BasePluginDataRetriever base class as the Kraken and Binance
connectors, publishes through the same HelperOrderBook and HelperTrade singletons, and reaches
every study through the same synchronous dispatch. Almost nothing downstream knows about replay:
studies, charts and view models consume the feed they always consume. The one exception is an opt-in
hook, IPostStartInitializable, that a plugin implements only if its child view models must re-read
settings after a routed restart.
The only per-message difference is the provider identity stamped on the data: ProviderID = 98,
"Historical File". That single decision is what makes everything on this page work, and it is why
the routing step in Driving the replay console exists.
What VisualHFT reads today
Four formats are selectable in the Replay Engine’s format picker. This is the complete list as shipped, not a roadmap.
| Format string | What it is | Typical extension | Multi-file support |
|---|---|---|---|
pcap-TV-NASDAQ-5 | NASDAQ TotalView-ITCH 5.0 over MoldUDP64, captured to pcap | .pcap | Yes, one whole directory, concatenated in filename order |
FIX 4.2 | FIX 4.2 tag=value text logs | any text file | Yes, several files merged by timestamp |
VHFT-BIN-1 | VisualHFT’s own binary capture format | .vhftbin | Single file |
VHFT-SESS-1 | A Session Recorder session container | .vhftsess | Single file; the container holds several streams but replay reads only single-stream sessions |
Everything else routes through one of those four, or through a converter you write. Both routes are covered below.
Feature availability
This page names a lot of surfaces, so here is the entitlement map up front, taken from the shipping catalog. Two things are tracked separately: the tier floor (the plan you must be on) and whether the item is bundled with that plan or a separate paid add-on.
| Capability | Tier floor | Bundled or add-on |
|---|---|---|
| Replay Engine (Paths A, B and D below) | Pro | Bundled, no extra charge |
Session Recorder (.vhftsess capture plus export) | Pro | Separate paid add-on |
Event Capture Recorder (.vhftbin trigger capture) | Pro | Separate paid add-on |
| Microstructure Diagnostics (execution-log TCA) | Pro | Separate paid add-on |
| LOB Imbalance, VPIN, Market Resilience and its Bias variant, Order-to-Trade Ratio, Time and Sales, Quotes and Level 2 DOM, LOB TimeSeries, Position Manager | Community | Bundled |
| Market Ratios, Trade-to-Order Ratio, Market Event Stats, Market Latencies Stats, Network Performance Monitoring | Core | Bundled |
Read that table as the answer to “what do I need to buy to do the thing in this section”. Confirm current plan and add-on availability before relying on a paid surface. The whole replay half of this page needs Pro and nothing else. Only the recording half (Path C) and the TCA surface are separately purchased.
How add-ons arrive: rather than being packaged in the installer, they are delivered per user as an encrypted assembly after purchase, so a purchase reaches your installed copy without a reinstall.
Path A: you already have exchange-native captures
Tier: included with Pro. The Replay Engine is bundled; nothing here is a separate purchase.
If you have NASDAQ TotalView-ITCH 5.0 pcap files, you are done choosing formats. Point the engine at them. This section uses a real capture: a full trading day of NASDAQ TotalView-ITCH for 22 August 2023, 103 pcap files, 37.0 GB.
The configuration
Open the Replay Engine settings from the gear on the replay console, set your symbols, choose pcap-TV-NASDAQ-5, tick Is Directory?, and pick any file inside the folder. VisualHFT stores the folder, enumerates every *.pcap in it, and plays them as one continuous session.
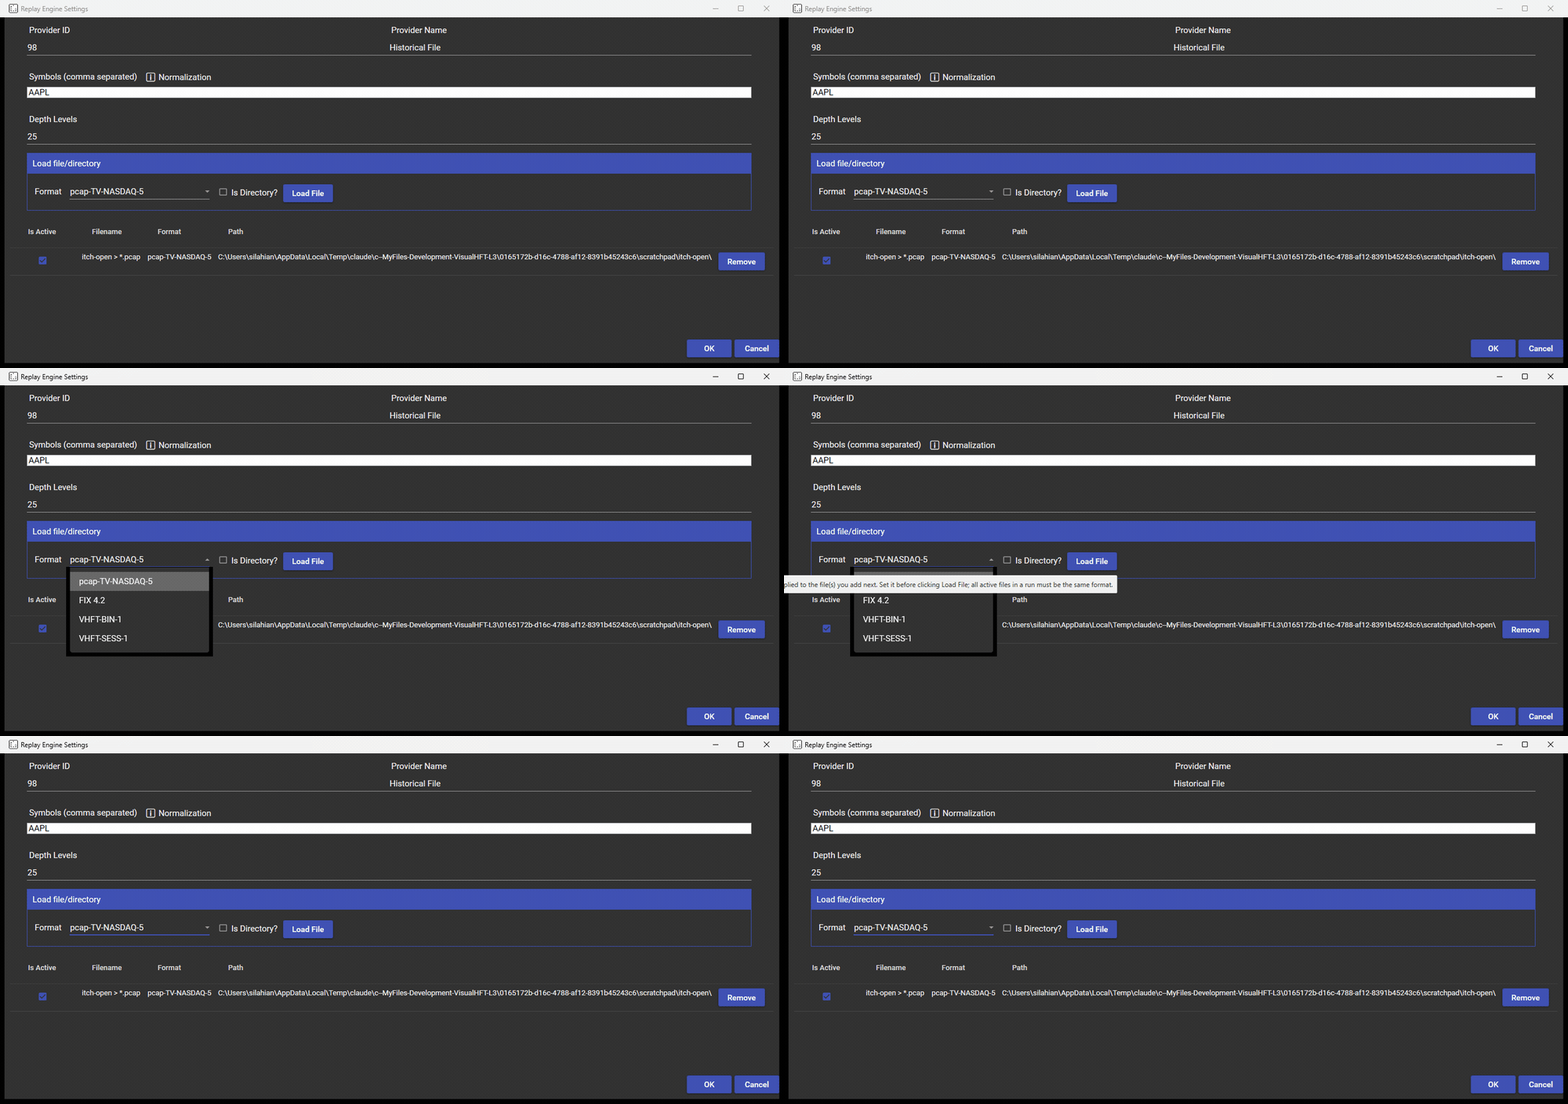
Three things put an ITCH capture on the dashboard. Set all three and the tape plays.
Symbols must match the ITCH Stock field exactly. The comparison is ordinal and case sensitive. AAPL works; AAPL.US typed on its own does not. The normalization form does work, though: write AAPL(AAPL.US) and the parser matches on the raw left side while the dashboard displays the right one.
The capture must include its StockDirectory segment. ITCH announces each instrument with an 'R' message. The parser keeps a dictionary keyed on the 2-byte StockLocate, and admits an entry only when two gates pass: the announcement’s financial-status byte is literally 'N', and the symbol is one you configured. Every later message (adds, executions, cancels, deletes, replaces, trades, crosses) is then looked up by that numeric locate and dropped if it is missing. Data flows from the moment the 'R' for your symbol arrives, so include the segment that carries it.
Directory order is filename order, not timestamp order. The engine sorts *.pcap by name and concatenates. That is correct for session logs written as sequential time segments, which is how these captures are normally chunked. It is wrong if you drop unrelated files with clashing names into the same folder.
Where the activity is in a full-day capture
A full-day capture spans midnight to midnight, and the activity you want sits inside the trading session. Knowing where that window opens is what gets you to the interesting part of the tape in seconds.
Measuring the real corpus makes the point precisely. Scanning the segments directly:
| Segment (file name is UTC) | ITCH messages | StockDirectory | AddOrder | Data window (Eastern) |
|---|---|---|---|---|
...T000000.pcap | 247,829 | 0 | 0 | 20:00:00 to 20:05:00 |
...T070000.pcap | 295,894 | 11,328 | 0 | 03:02:01 to 03:09:00 |
...T071000 through ...T075000 | 0 to 5 | 0 | 0 | almost nothing |
...T133000.pcap | 20,288,210 | 0 | 8,889,490 | 09:29:59 to 09:39:59 |
Two facts fall out of that table, and both matter.
First, the file names are UTC while the ITCH clock inside them is Eastern. The T000000 segment carries data stamped 20:00, because ITCH 5.0 timestamps are nanoseconds since midnight Eastern and the capture host rolled its files on UTC. Read the virtual clock as the capture’s own Eastern session time, and take your segments from inside the trading session so clock and data line up.
Second, the entire symbol directory arrives in one burst early in the session. In this capture the 'R' blast is in the T070000 segment (03:02 to 03:09 Eastern), which is why that one file is 31.9 MB while each of the five segments after it is under 50 KB. AAPL is announced there at 03:06:44 with StockLocate = 32, MarketCategory = 'Q', FinancialStatusIndicator = 'N', round lot 100. That last field is load-bearing: the parser admits an instrument whose financial-status byte is exactly 'N', the normal-trading value you want.
How to skip to where the action is
Because directory replay is plain filename-ordered concatenation, you can compose a smaller directory containing only the segments you care about. The rule is simply that the segment carrying the StockDirectory must come first.
For the opening auction, a three-file directory is enough:
ny4-xnas-tvitch-a-20230822T070000.pcap    the StockDirectory blast, 31.9 MB
ny4-xnas-tvitch-a-20230822T132000.pcap    the pre-open ramp, 349 MB
ny4-xnas-tvitch-a-20230822T133000.pcap    the opening auction, 1.85 GB
Copy or hard-link those three into a folder of their own and point the engine at it. The engine registers AAPL from the first segment, paces through the quiet stretch, warms the book on the pre-open ramp, and arrives at the auction.
One thing to plan for: the resting book builds from your first segment onward. Orders placed before it and cancelled or executed inside it are dropped rather than invented as a level, and on the open the book refills within seconds as the auction floods it with fresh orders. Include the segments from the session start when you want a fully warm book.
The other lever is the speed control. The gap between the directory blast and the pre-open is over six hours of data time, which at 1000x is about twenty seconds of wall time. Set a high speed to cross the dead zone, then drop back to 1x or 10x when you reach the window you actually want to watch.
Path B: FIX 4.2 text logs
Tier: included with Pro.
Select FIX 4.2 and add your log files individually. Unlike pcap, the text path does a real streaming k-way merge across files: it keeps at most one buffered message per file and repeatedly emits the globally earliest timestamp. That is result-equivalent to a global sort as long as each file is internally chronological, at O(number of files) memory instead of O(total messages).
Snapshot, incremental refresh, new order single, execution report and cancel-replace are all handled on this path.
Two practical constraints: all active files must share one extension (the settings dialog blocks a save that mixes them, and the engine re-validates at play time), and a directory feed is a pcap-only feature. FIX files are selected individually.
Path C: record it inside VisualHFT
Tier note. Both recorders below are separate paid add-ons on top of Pro. Everything else in this guide is bundled with Pro.
If the data you want does not exist yet, capture it from a live connector and replay it later. VisualHFT ships two recorders, and they write different things for different reasons.
Session Recorder does continuous, session-long capture to a single .vhftsess container. It records full order-book frames and trades across one or more provider/symbol/aggregation streams, plus the decimal-exact value of every study metric you select, recorded on change alongside the raw feed. Sessions land in Documents\VisualHFT\Sessions by default. Capture is crash-safe: a write-probe refuses to start when the target is not writable, periodic checkpoint frames keep a torn session partly recoverable, and a disk-full condition finalizes and stops rather than taking the app down.
Event Capture Recorder does trigger-driven forensic capture to .vhftbin (VHFT-BIN-1). It continuously buffers live streams in a ring and, when a TriggerEngine rule fires, writes only the pre/post-event slice. Files land in Documents\VisualHFT\Recordings, named from the template {trigger}_{symbol}_{provider}_{utc:yyyyMMdd-HHmmss}.vhftbin, so the file name tells you which rule produced it and when.
The difference is intent. Session Recorder is “keep everything for this session”. Event Capture Recorder is “keep the sixty seconds around every liquidity shock and throw the rest away”.
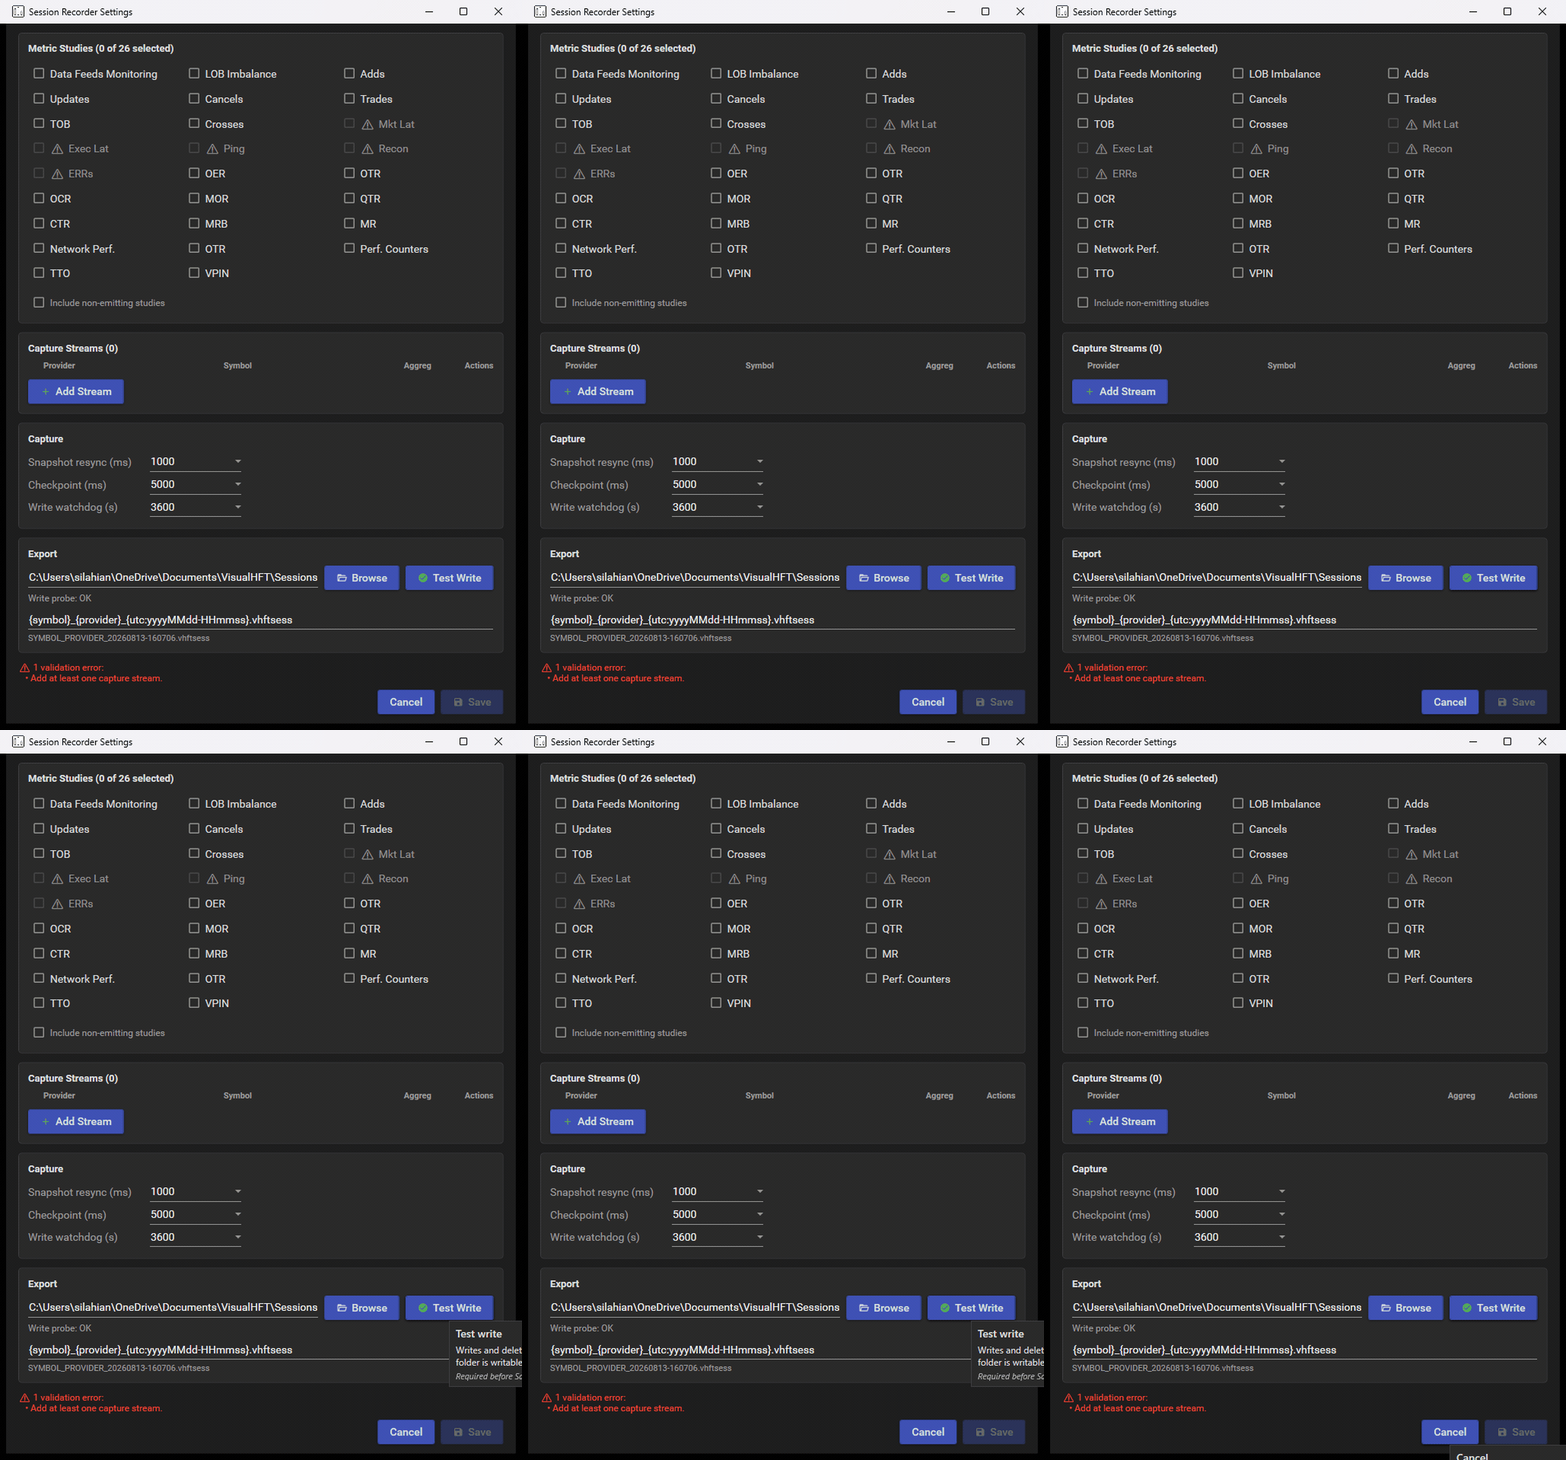
The recorder lives on the shell footer next to the replay console, with its own status rail: a state dot, a transport button, a live stream and study count, and a warning chip while it still needs configuration.
Its settings window is where the actual decisions are made, and it is worth walking through because each block maps to something you will care about later:
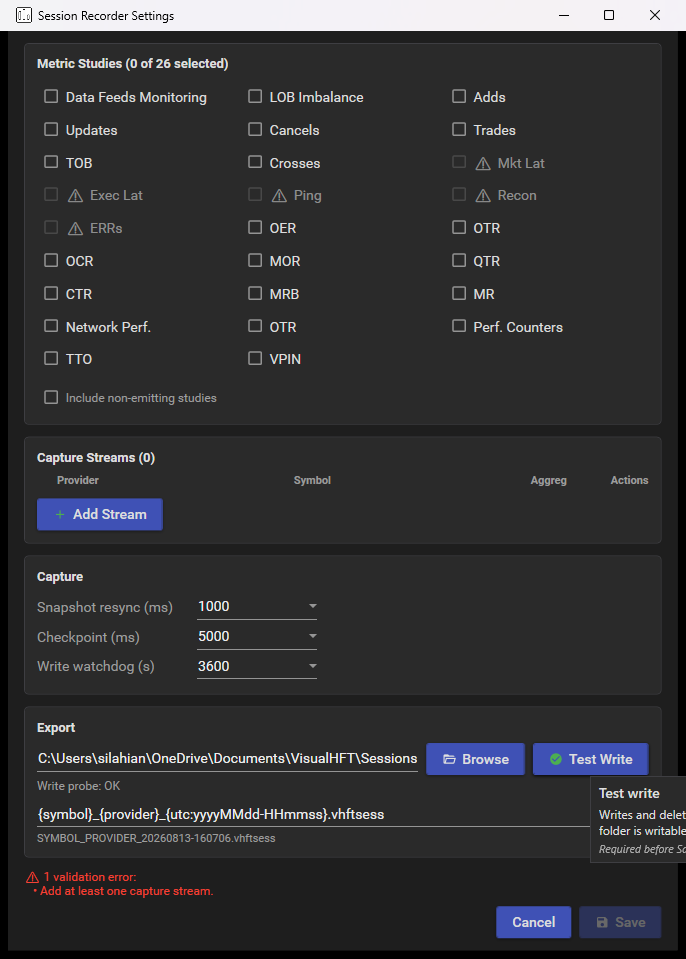
- Metric Studies. A grid of 26 selectable studies (LOB Imbalance, VPIN, MR, MRB, OTR, TTO, OER, OCR, MOR, QTR, CTR, Adds, Updates, Cancels, Trades, TOB, Crosses, latency and reconnect counters, and so on). Whatever you tick is recorded, decimal-exact and on change, alongside the raw feed. Studies that are not configured are greyed out with a warning icon explaining why; a separate tick widens the list to every loaded study, including the ones whose output is visual rather than metric.
- Capture Streams. One row per provider, symbol and aggregation level. This is the list that decides what raw book and trade data lands in the file.
- Capture cadences. Snapshot resync defaults to 1000 ms, the durability checkpoint to 5000 ms, and the write watchdog to 3600 s. The first controls how often a full keyframe is forced; the second is what makes a torn file partly recoverable.
- Export. The output folder (defaulting to your Documents
VisualHFT\Sessions), a Test Write button that runs the write probe and reportsWrite probe: OK, and the file-name template{symbol}_{provider}_{utc:yyyyMMdd-HHmmss}.vhftsesswith a live preview of the name it will produce.
The dialog will not let you save an unusable configuration. With no stream selected it shows 1 validation error: above a bulleted Add at least one capture stream. and keeps Save disabled. Once armed, stopping finalizes off the UI thread, because the stop path blocks on a drain of the write queue before it writes the footer.
Record one stream per session when replay is the goal. The reader replays single-stream sessions, and a multi-stream file reports a clear error rather than replaying into silent corruption.
Worth knowing about the on-disk shape: the Session Recorder is snapshot-based. Inside the .vhftsess container every book record is a 0x10 envelope wrapping a VHFT-BIN-1 body (metrics are 0x04, checkpoints 0x20). The recorder stamps that inner body 0x01 on the first frame and every resync interval and 0x02 in between, but unlike a hand-written VHFT-BIN-1 file both carry the complete book: the recorder never emits an incremental delta. That is stated in the export schema sidecar the exporter emits alongside every export, and it means you can reconstruct the book at any timestamp by taking the latest frame at or before it. No replay state machine required.
Path D: everything else, via a converter
Tier: included with Pro. Writing the converter is your side; reading the result is bundled.
This is the path that opens VisualHFT to any tape you already own: a vendor tick store, a kdb table, a Parquet dump, a CSV export, or a proprietary binary feed. Convert it once and it replays like a native capture.
The supported route is to convert it to VHFT-BIN-1. The format is small enough to implement in an afternoon in any language, and the rest of this section is the complete contract plus a working converter.
The file layout
A 256-byte header, then a sequence of frames, then a 64-byte footer. Everything is little-endian. All timestamps are nanoseconds since the Unix epoch, as signed 64-bit integers.
Header (256 bytes), the fields that matter:
| Offset | Size | Field |
|---|---|---|
| 0 | 8 | Magic, ASCII VHFTBIN1 |
| 8 | 2 | FormatMajor (uint16), currently 1 |
| 10 | 2 | FormatMinor (uint16), currently 0 |
| 12 | 4 | HeaderSize (uint32), 256 |
| 16 | 8 | CreatedAtUtcNs (int64) |
| 48 | 4 | ProviderID (int32) |
| 52 | 32 | Symbol, UTF-8, null-padded |
| 84 | 4 | AggregationLevel (int32) |
| 88 | 4 | PriceDecimalPlaces (int32) |
| 92 | 4 | SizeDecimalPlaces (int32) |
| 96 | 8 | SymbolMultiplier (float64) |
| 104 | 4 | DepthLevels (int32) |
The remaining fields, at offsets 24, 32, 40 and 108 through 195, carry trigger provenance (which rule fired, its pre and post windows, its threshold, and the metric value at fire time) and are only meaningful for Event Capture Recorder output. Leave those zero.
PriceDecimalPlaces and SizeDecimalPlaces are load-bearing. VHFT-BIN-1 carries its own precision rather than assuming one, so prices and sizes are stored as scaled integers and recovered as priceTicks / 10^PriceDecimalPlaces and sizeRaw / 10^SizeDecimalPlaces. Get these wrong and your book renders at the wrong order of magnitude.
Book frames, discriminator 0x01 (full snapshot) or 0x02 (delta):
byte    0        discriminator (0x01 or 0x02)
int64   1..8     tsNs          exchange timestamp
int64   9..16    localTsNs     local receive timestamp
uint16  17..18   nAsks
uint16  19..20   nBids
then nAsks levels, then nBids levels, 16 bytes each:
  int64  priceTicks
  int64  sizeRaw
Asks come first, then bids. On a 0x02 delta frame, a level with sizeRaw == 0 is the wire signal for “this level was removed”.
Trade frames, discriminator 0x03, fixed 35 bytes:
byte    0        0x03
int64   1..8     tsNs
int64   9..16    localTsNs
int64   17..24   priceTicks
int64   25..32   sizeRaw
byte    33       side       0 unknown, 1 buy, 2 sell
byte    34       aggressor  0 unknown, 1 buy, 2 sell
Write 0 for anything your source does not tell you. Do not infer an aggressor the source did not provide; VisualHFT records unknown as unknown deliberately, because a fabricated aggressor flag silently corrupts trade classification downstream.
Footer (64 bytes):
byte    0        0xFF
int64   1..8     FrameCount
uint32  9..12    CRC32
bytes   13..63   reserved, zero
The CRC is classical CRC-32 (IEEE 802.3, polynomial 0xEDB88320, reflected input and output, init and xor-out 0xFFFFFFFF) computed over the file from offset 0 through byte 8 of the footer inclusive. In other words, header plus all frames plus the footer’s discriminator and frame count. The CRC field itself and the reserved tail are excluded.
Three behaviours to design against:
- Bad magic or bad CRC is a hard reject. The parser throws. This is deliberate: silent acceptance of a corrupt capture is worse than a loud failure.
- A missing or partial footer is treated as truncation, not corruption. The parser emits every frame that decoded cleanly, reports
Truncated, and the app shows a warning. Crash-interrupted captures stay useful. - A full snapshot must precede any delta. The parser treats a delta arriving before its anchoring snapshot as a corruption signal. Start every file with a
0x01.
A working converter
Here is a complete converter, in plain Python with no dependencies, that turns two ordinary CSVs into a playable capture. The book CSV needs ts_ns_utc, local_ts_ns, side, level_index, price, size; the trade CSV needs ts_ns_utc, local_ts_ns, price, size, side, aggressor.
#!/usr/bin/env python3
"""csv_to_vhftbin.py - convert order-book and trade CSVs into a VHFT-BIN-1 capture."""
import argparse, csv, struct, sys, time, zlib
from collections import defaultdict

MAGIC, HEADER_SIZE = b"VHFTBIN1", 256
SNAPSHOT_FULL, TRADE, FOOTER = 0x01, 0x03, 0xFF
SIDE = {"unknown": 0, "buy": 1, "sell": 2}


def build_header(symbol, provider_id, aggregation, price_dp, size_dp, depth):
    h = bytearray(HEADER_SIZE)
    h[0:8] = MAGIC
    struct.pack_into("<H", h, 8, 1)                         # FormatMajor
    struct.pack_into("<H", h, 10, 0)                        # FormatMinor
    struct.pack_into("<I", h, 12, HEADER_SIZE)              # HeaderSize
    struct.pack_into("<q", h, 16, int(time.time() * 1e9))   # CreatedAtUtcNs
    struct.pack_into("<i", h, 48, provider_id)              # ProviderID
    sym = symbol.encode("utf-8")[:32]                       # 32-byte UTF-8 slot
    h[52:52 + len(sym)] = sym
    struct.pack_into("<i", h, 84, aggregation)              # AggregationLevel
    struct.pack_into("<i", h, 88, price_dp)                 # PriceDecimalPlaces
    struct.pack_into("<i", h, 92, size_dp)                  # SizeDecimalPlaces
    struct.pack_into("<d", h, 96, float(10 ** price_dp))    # SymbolMultiplier
    struct.pack_into("<i", h, 104, depth)                   # DepthLevels
    return bytes(h)


def book_frame(ts, lts, asks, bids):
    out = bytearray([SNAPSHOT_FULL])
    out += struct.pack("<qqHH", ts, lts, len(asks), len(bids))
    for px, sz in asks + bids:
        out += struct.pack("<qq", px, sz)
    return bytes(out)


def trade_frame(ts, lts, px, sz, side, aggressor):
    return struct.pack("<BqqqqBB", TRADE, ts, lts, px, sz, side, aggressor)


def read_book(path, pscale, sscale):
    frames = defaultdict(lambda: {"ask": [], "bid": []})
    with open(path, newline="", encoding="utf-8-sig") as f:
        for row in csv.DictReader(f):
            key = (int(row["ts_ns_utc"]), int(row["local_ts_ns"]))
            side = "bid" if row["side"].strip().lower() in ("bid", "1") else "ask"
            frames[key][side].append((int(round(float(row["price"]) * pscale)),
                                      int(round(float(row["size"]) * sscale)),
                                      int(row["level_index"])))
    out = []
    for (ts, lts), s in frames.items():
        pick = lambda rows: [(p, z) for p, z, _ in sorted(rows, key=lambda r: r[2])]
        out.append((ts, lts, pick(s["ask"]), pick(s["bid"])))
    out.sort(key=lambda r: r[0])
    return out


def read_trades(path, pscale, sscale):
    out = []
    with open(path, newline="", encoding="utf-8-sig") as f:
        for r in csv.DictReader(f):
            out.append((int(r["ts_ns_utc"]), int(r["local_ts_ns"]),
                        int(round(float(r["price"]) * pscale)),
                        int(round(float(r["size"]) * sscale)),
                        SIDE.get(r.get("side", "").strip().lower(), 0),
                        SIDE.get(r.get("aggressor", "").strip().lower(), 0)))
    out.sort(key=lambda r: r[0])
    return out


def main():
    ap = argparse.ArgumentParser()
    ap.add_argument("--book", required=True)
    ap.add_argument("--trades")
    ap.add_argument("--symbol", required=True)
    ap.add_argument("--out", required=True)
    ap.add_argument("--price-dp", type=int, default=2)
    ap.add_argument("--size-dp", type=int, default=8)
    ap.add_argument("--provider-id", type=int, default=0)
    ap.add_argument("--aggregation", type=int, default=0)
    # Use when the CSV already holds scaled integer ticks rather than decimals.
    ap.add_argument("--raw-ticks", action="store_true")
    a = ap.parse_args()

    pscale = 1 if a.raw_ticks else 10 ** a.price_dp
    sscale = 1 if a.raw_ticks else 10 ** a.size_dp

    books = read_book(a.book, pscale, sscale)
    trades = read_trades(a.trades, pscale, sscale) if a.trades else []
    if not books:
        sys.exit("no book frames parsed")
    depth = max(max(len(x), len(y)) for _, _, x, y in books)

    # One timestamp-ordered stream; book frames win ties so a snapshot always
    # precedes the trades at the same instant.
    stream = [(ts, 0, ("book", lts, ask, bid)) for ts, lts, ask, bid in books]
    stream += [(t[0], 1, ("trade",) + t[1:]) for t in trades]
    stream.sort(key=lambda r: (r[0], r[1]))

    crc, frames = 0, 0
    with open(a.out, "wb") as f:
        header = build_header(a.symbol, a.provider_id, a.aggregation,
                              a.price_dp, a.size_dp, depth)
        f.write(header); crc = zlib.crc32(header, crc)
        for ts, _, rec in stream:
            blob = (book_frame(ts, rec[1], rec[2], rec[3]) if rec[0] == "book"
                    else trade_frame(ts, rec[1], rec[2], rec[3], rec[4], rec[5]))
            f.write(blob); crc = zlib.crc32(blob, crc); frames += 1
        # 0xFF and FrameCount are inside the CRC window; the CRC field is not.
        tail = struct.pack("<Bq", FOOTER, frames)
        crc = zlib.crc32(tail, crc)
        f.write(tail)
        f.write(struct.pack("<I", crc & 0xFFFFFFFF))
        f.write(b"\x00" * 51)

    print("wrote %s: %d frames, depth %d, crc32=0x%08X"
          % (a.out, frames, depth, crc & 0xFFFFFFFF))


if __name__ == "__main__":
    main()
Running it against a real recorded session exported to CSV:
$ python csv_to_vhftbin.py --book book.csv --trades trades.csv \
      --symbol "BTC/USD" --price-dp 1 --size-dp 8 --raw-ticks \
      --provider-id 4 --aggregation 3 --out BTCUSD-20260625.vhftbin

wrote BTCUSD-20260625.vhftbin: 2495 frames, depth 25, crc32=0x8BC0E7C0
That is 1,948 book frames and 547 trades, 1.59 MB on disk, covering 217 seconds of tape.
Loading it
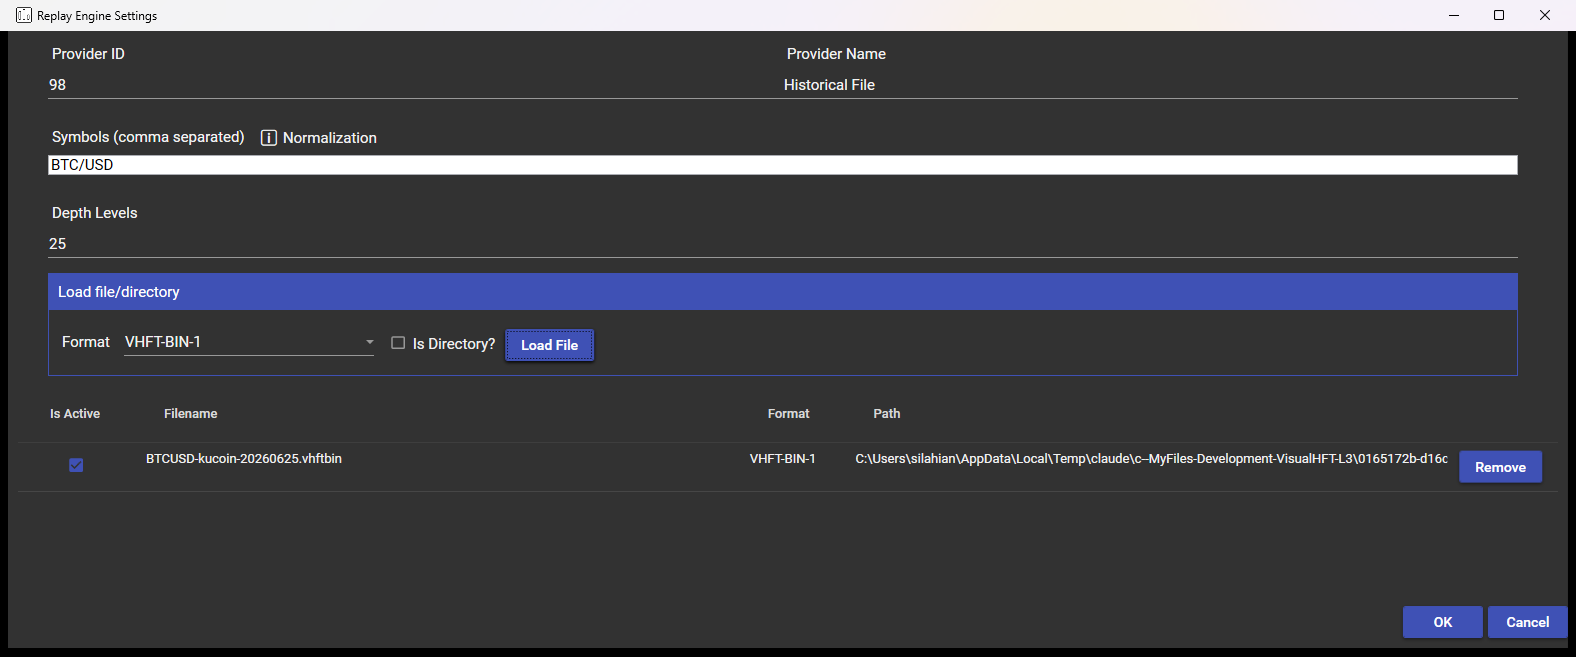
Open the replay settings, set the symbol to match what you wrote into the header, choose VHFT-BIN-1, and add the file. Select your .vhftbin file in the picker.
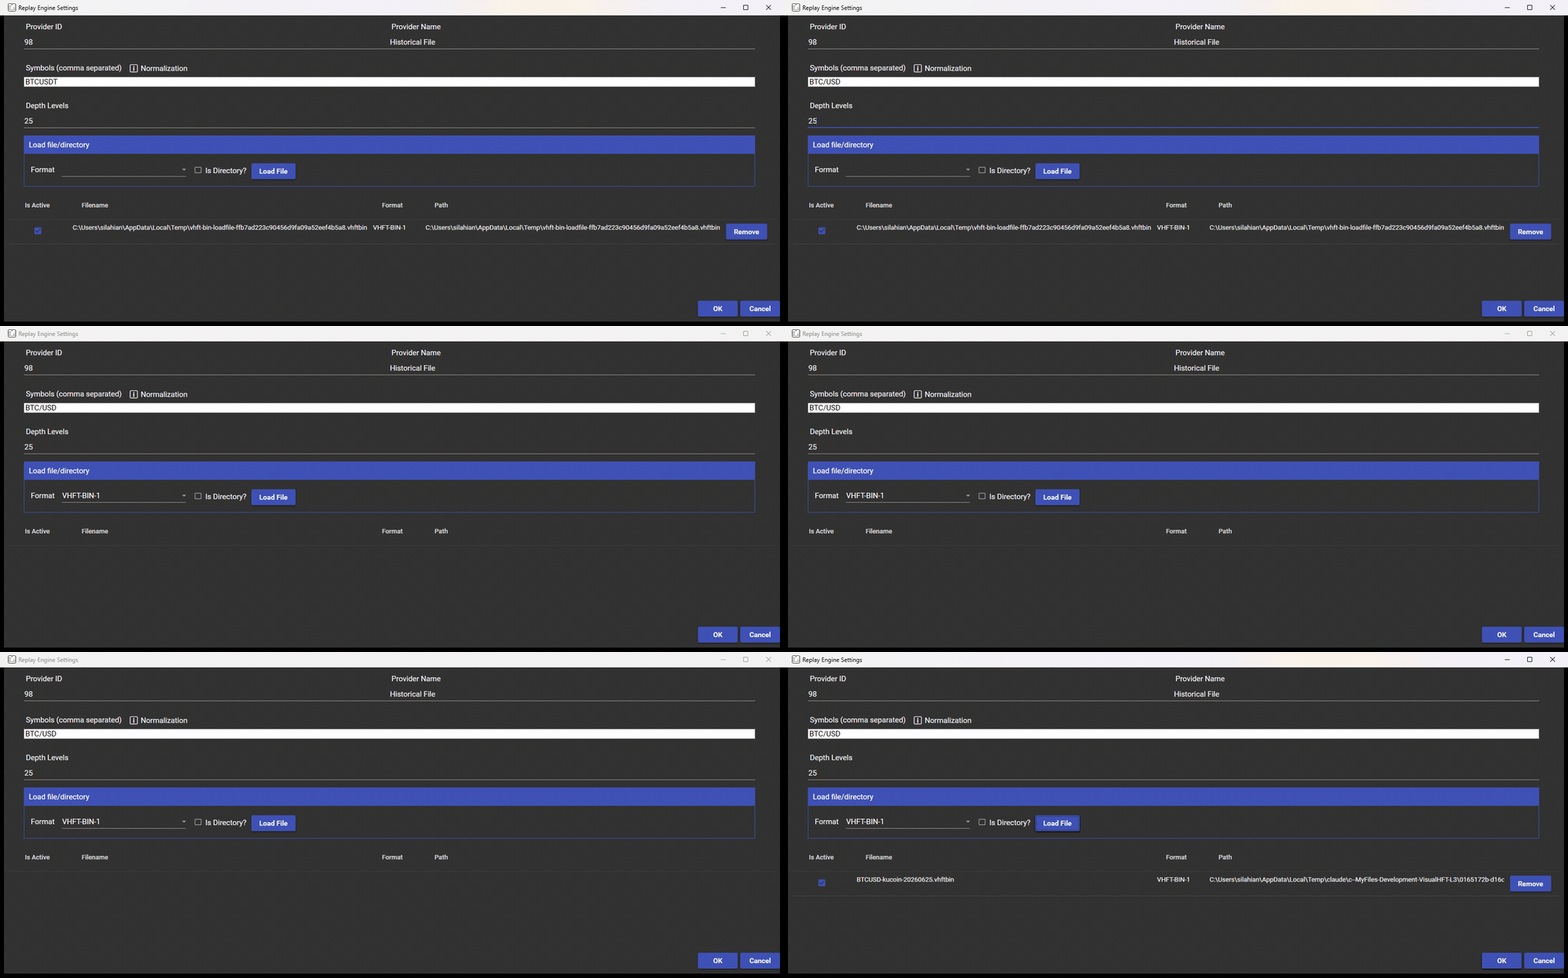
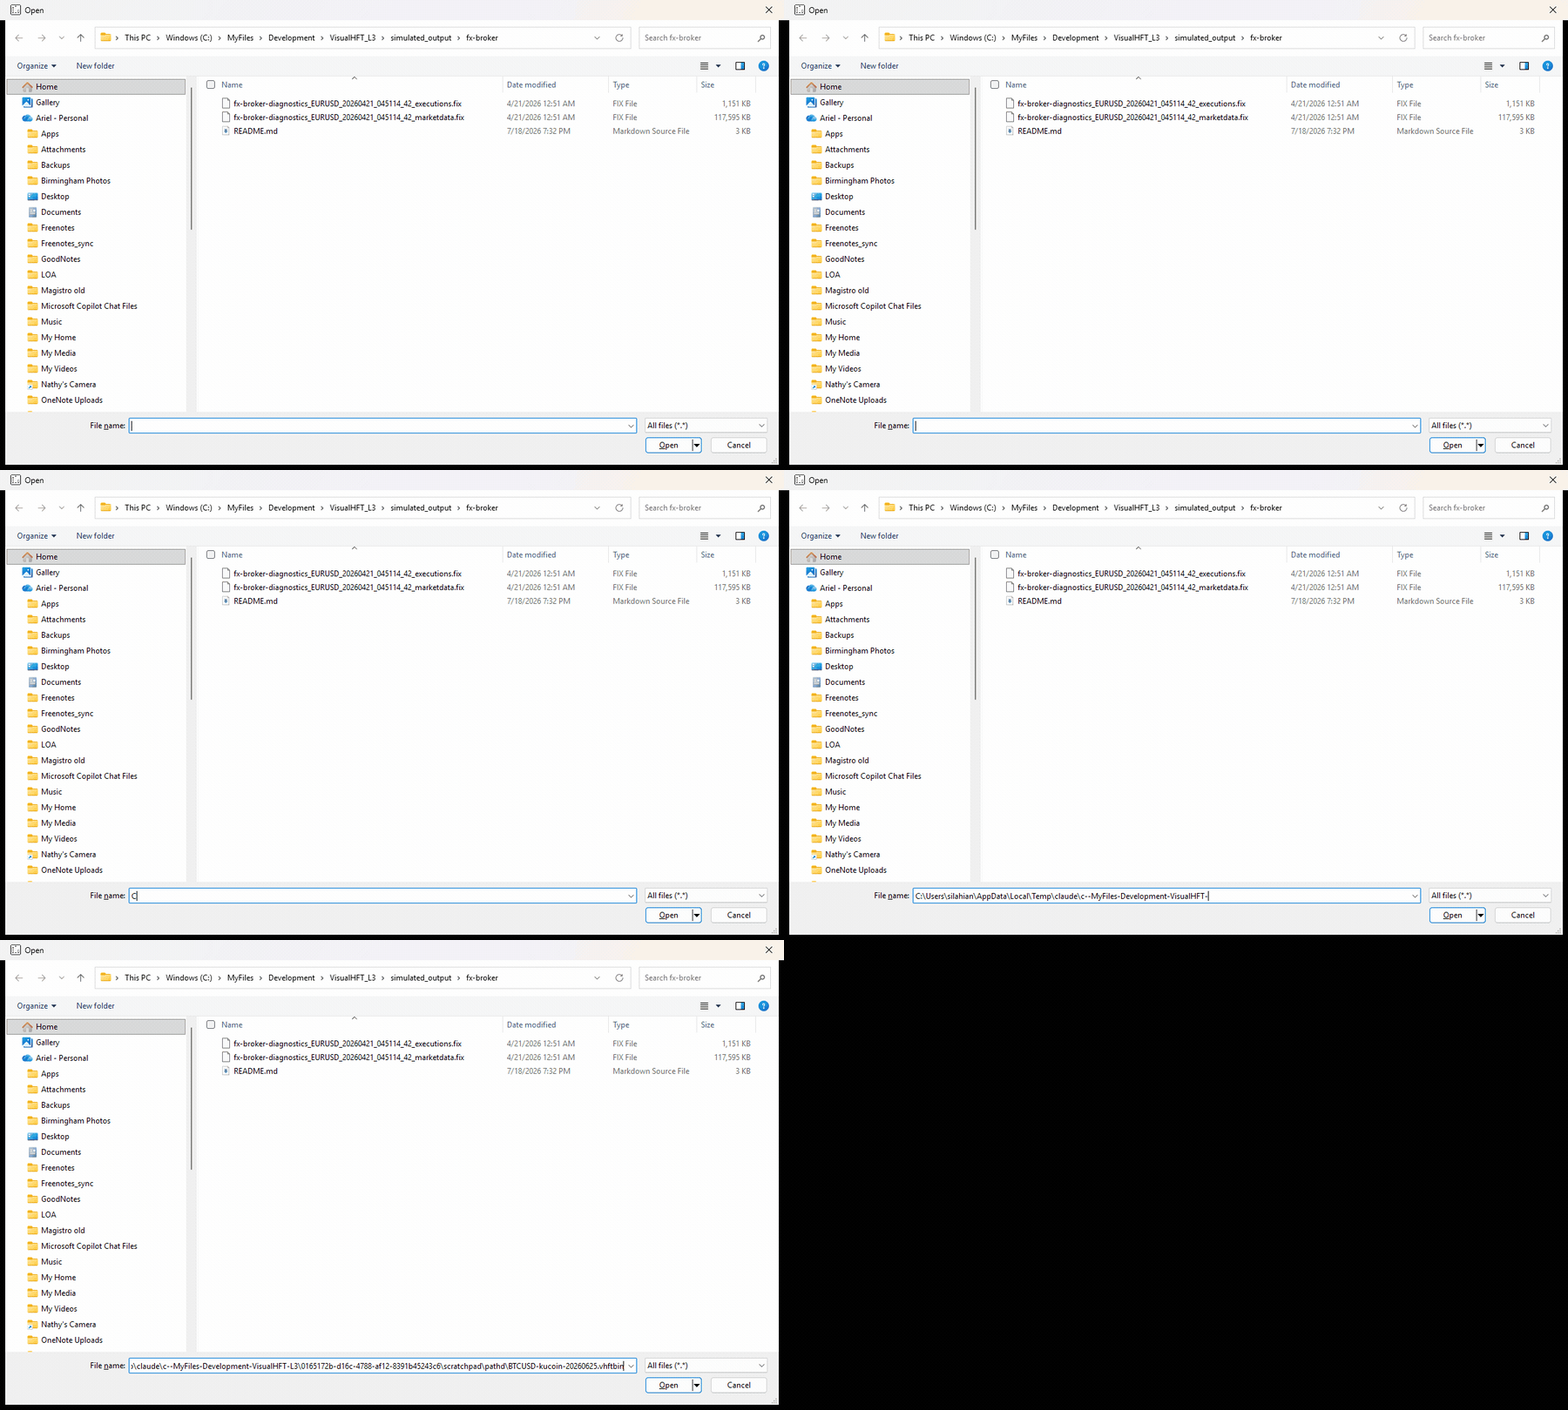
Then arm exclusive replay mode and press Play.
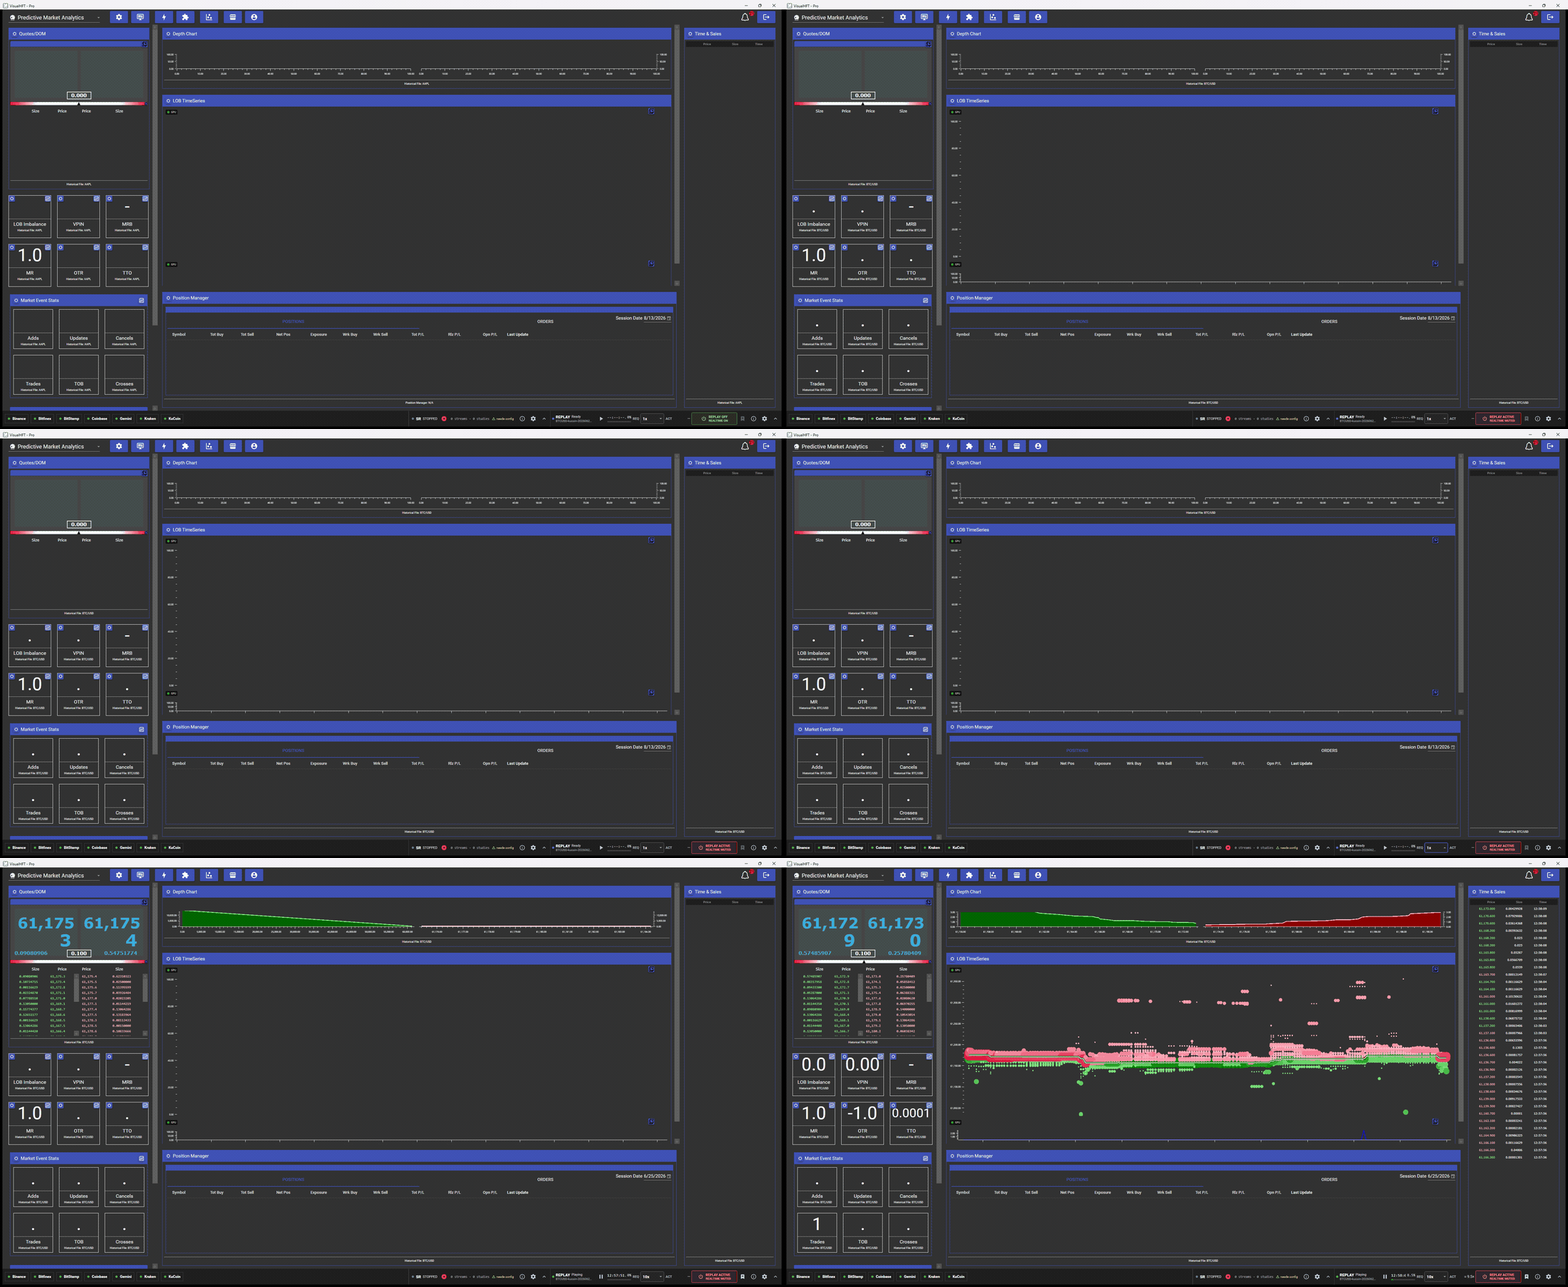
A few seconds later the converted file is driving the whole dashboard: full depth ladder, depth chart, LOB time series with resting-order bubbles, time and sales, and every study tile computing.
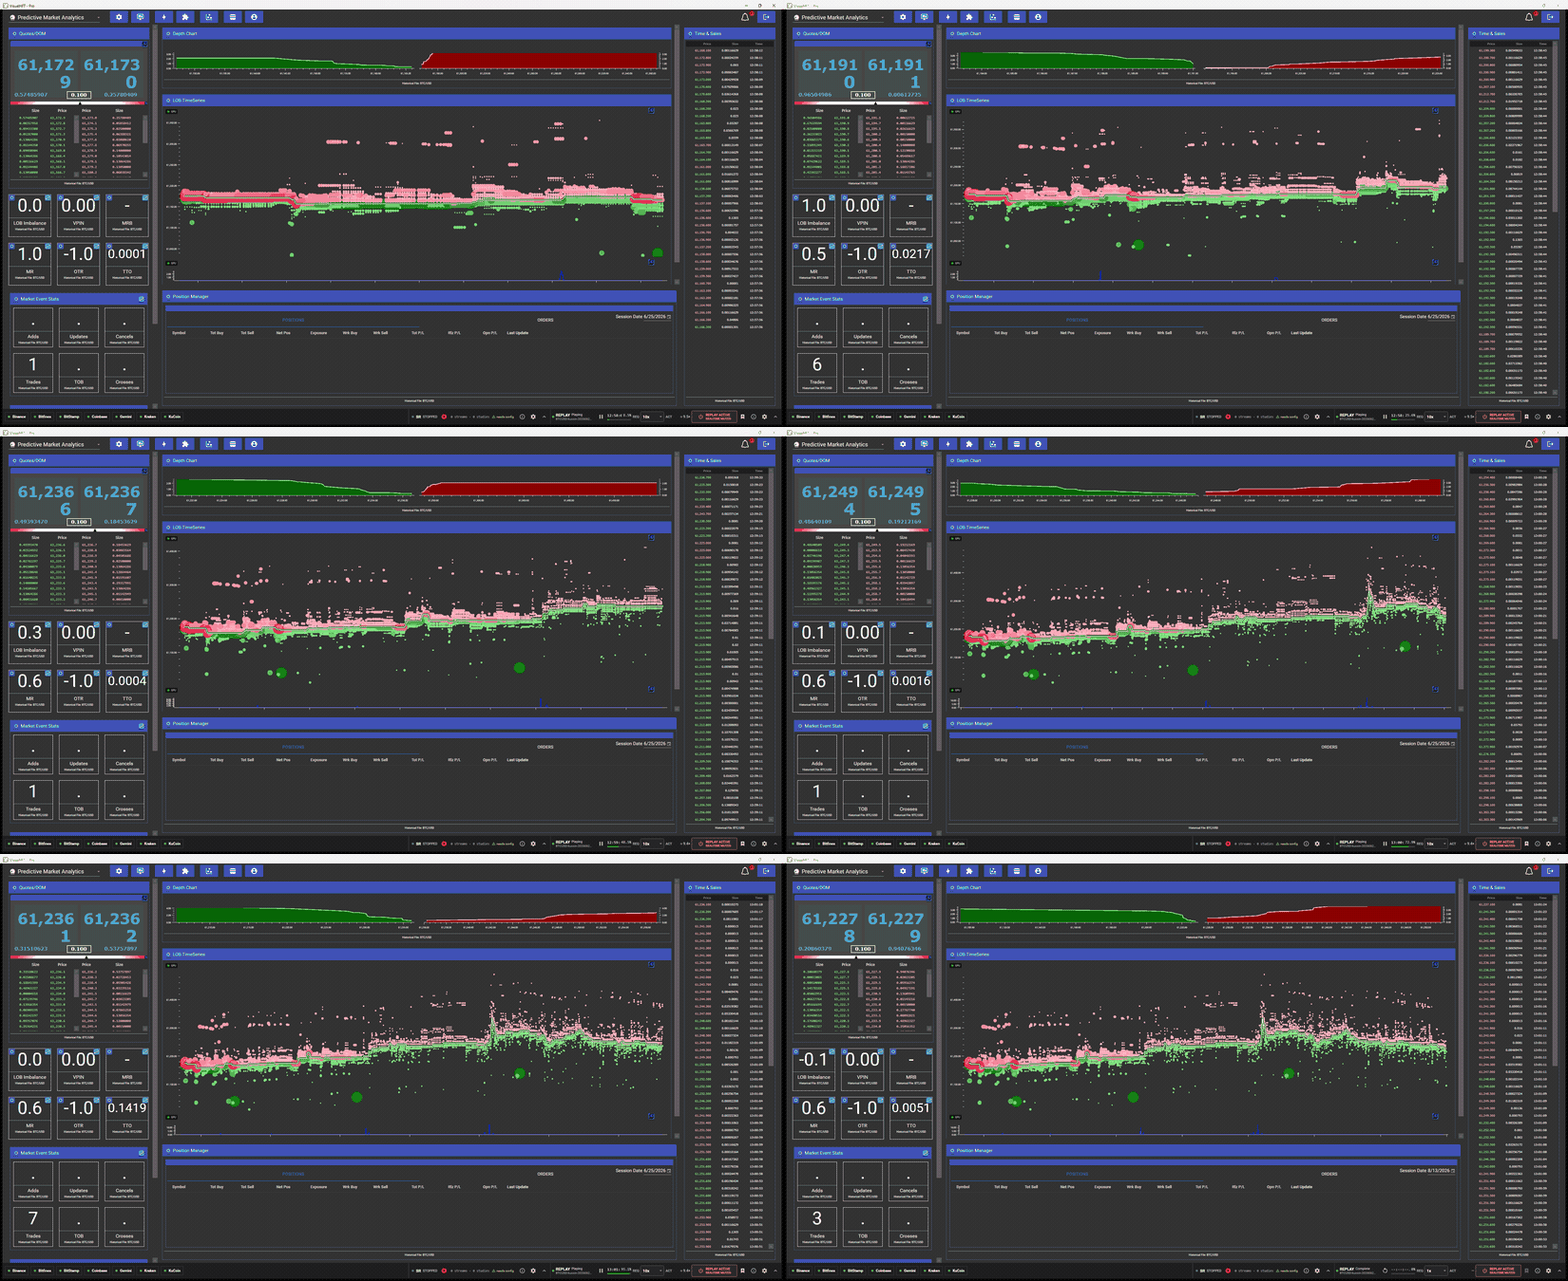
Nothing in that picture knows the data started life as a CSV.
Driving the replay console
Tier: included with Pro.
The replay console is a persistent rail in the shell footer. Collapsed, it shows state, virtual clock, progress, requested and achieved speed, the routing chip, the bookmark button, settings, and a chevron that opens the details flyout.
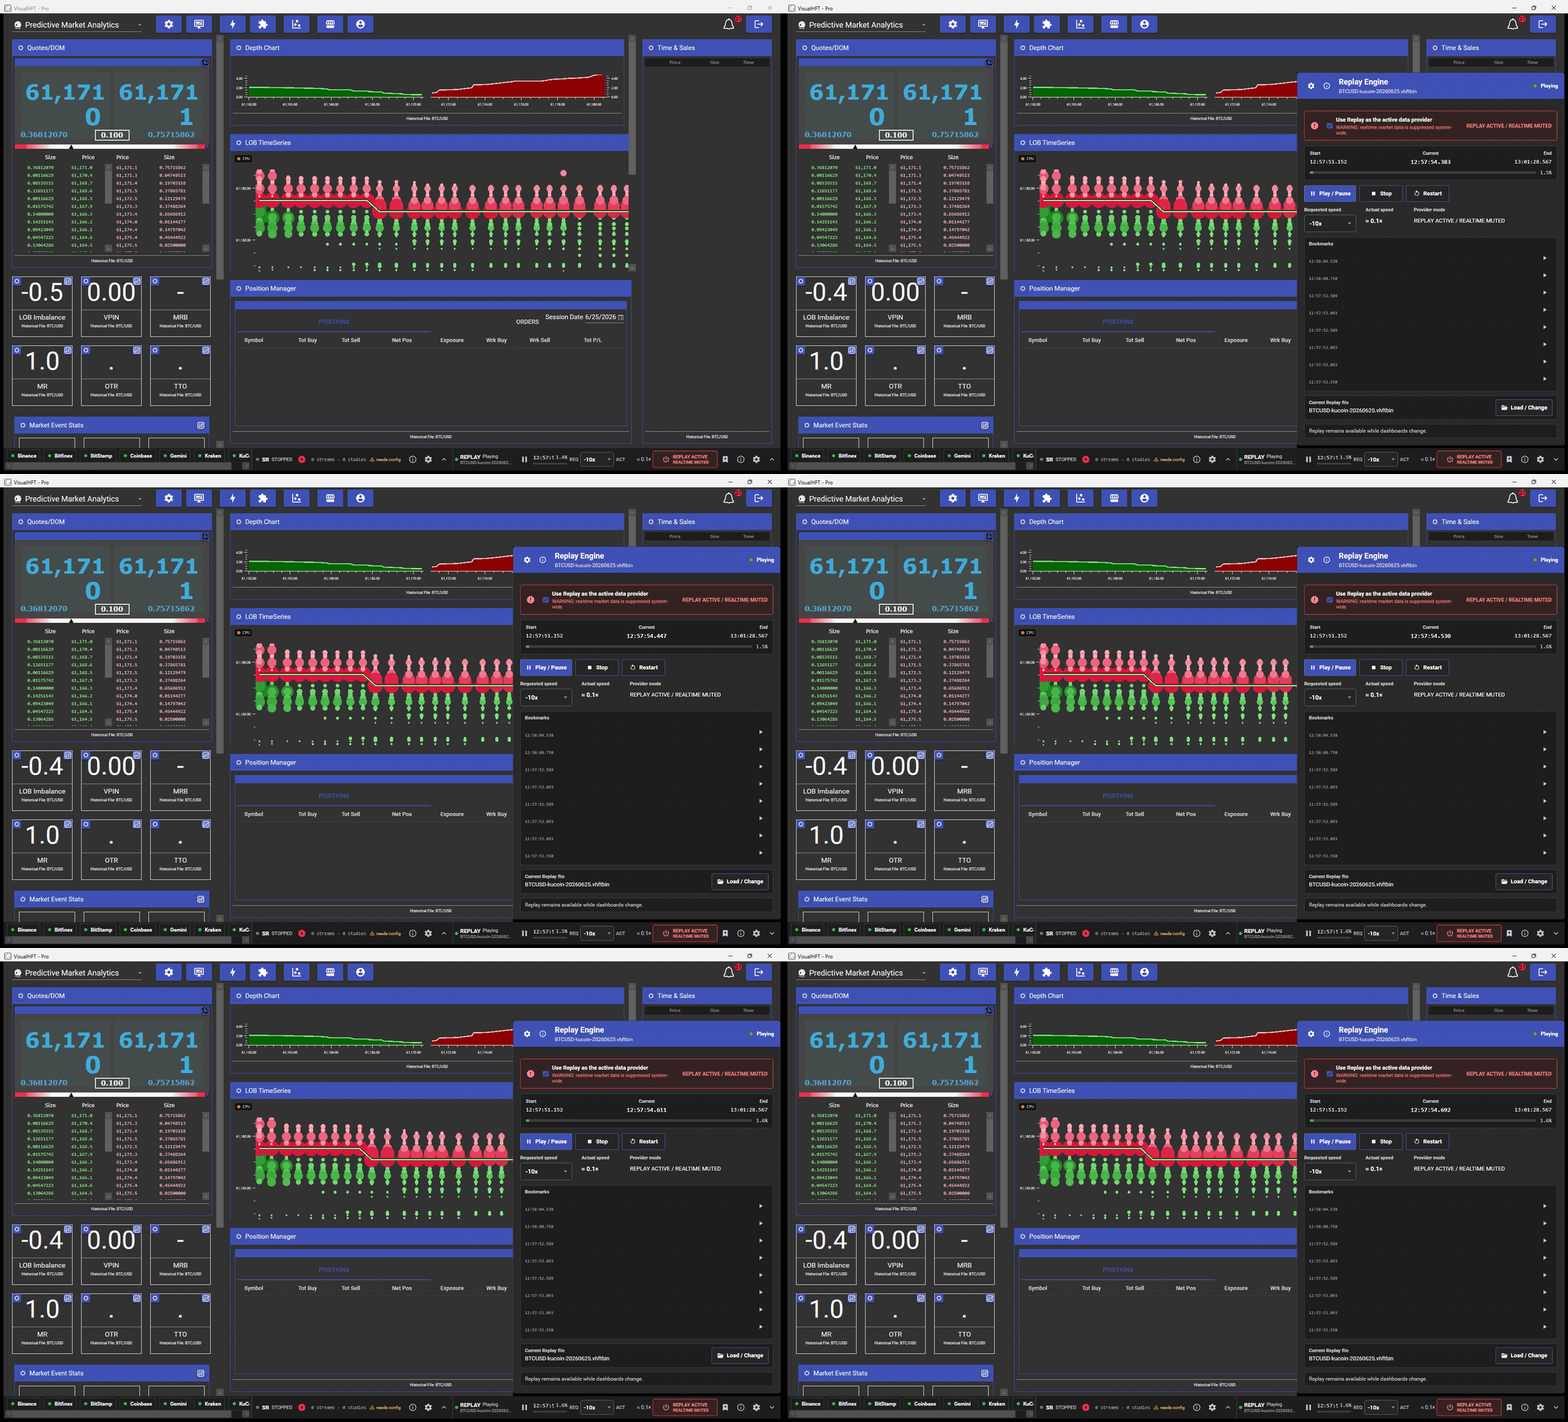
Expanded, it is the whole control surface in one panel:
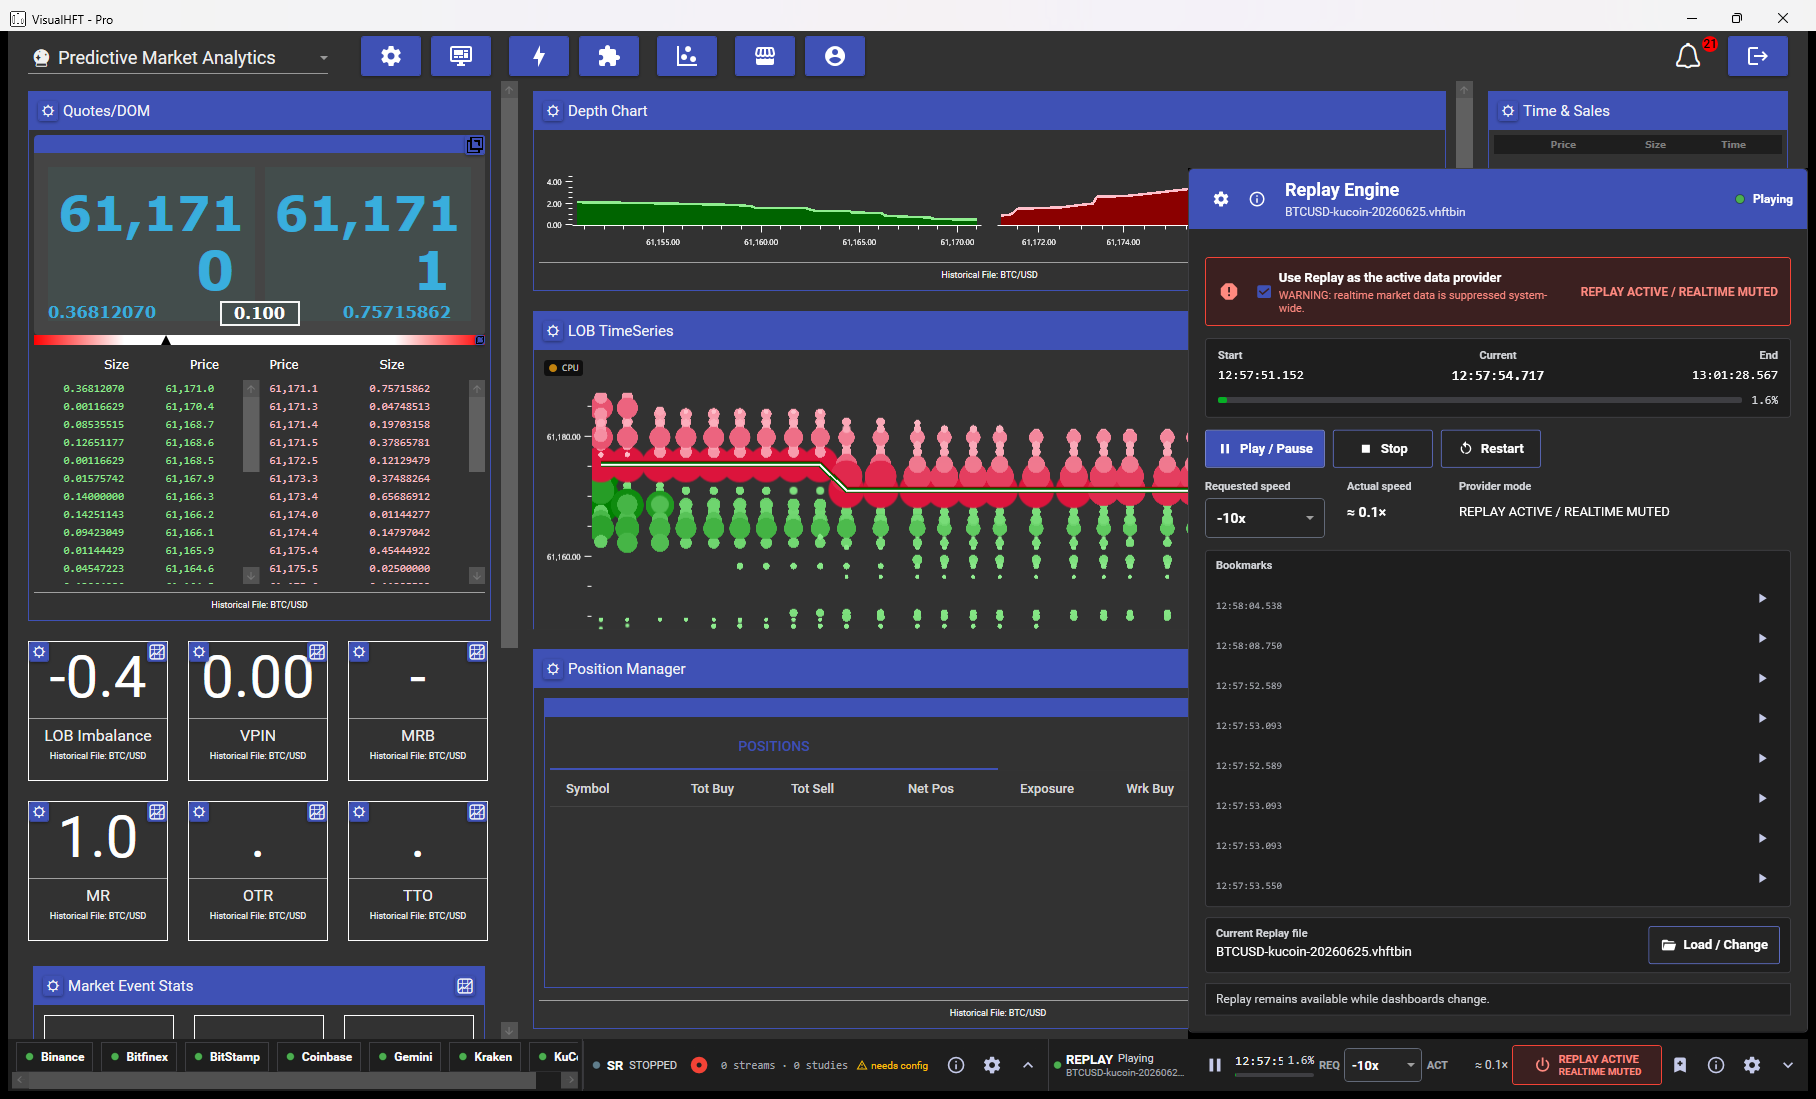
Start, current and end timestamps with a progress bar; Play/Pause, Stop and Restart; requested speed against actual speed; the provider mode; and the bookmark list. The red banner is deliberate: while exclusive routing is on, realtime market data is suppressed system-wide, and the panel says so rather than leaving you to discover it.
The settings dialog
Six things are configurable, and the OK button stays disabled with an inline reason until the configuration is structurally valid:
- Provider ID and Provider Name. These carry the reserved replay identity,
98andHistorical File, which is what routed studies listen for. Leave them as shipped and the tape reaches every routed tile. - Symbols, comma separated, in the venue’s own notation. Parentheses normalize a venue symbol to a canonical one, for example
BTCUSDT(BTC/USD). - Depth Levels, default 25. This is how many levels per side the engine reconstructs, and it costs CPU and memory.
- Format, which applies to the files you add next. Set it before clicking Load File. Keep every active file in the same format; the dialog and the engine both confirm the active set shares one extension before playing.
- Is Directory?, which turns the next selection into a whole-folder feed in filename order. Tick it for pcap captures; leave it unticked for
.vhftbinand.vhftsess, which load as single files. - The file list, where each row has its own Is Active tick and a Remove button. Unticking a row keeps it in the list but excludes it from the run, which is the quick way to swap between two captures without re-adding files.
Pressing OK saves and restarts the replay feed immediately. The dialog validates the structure of your configuration, so keep your captures where you pointed it and the file list stays good from save through Play.
Exclusive replay mode: routing the tape to every study
Engage exclusive replay mode and the whole dashboard computes on your capture: every study, chart and tile reads the tape instead of the live feed.
Every study filters incoming events against its own saved provider and symbol, so exclusive mode re-points each one at the replay identity for you instead of asking you to hand-edit every tile. VisualHFT engages the process-wide live mute first, so no live connector can emit into a half-swapped study during the transition, then per plugin clones its settings onto the replay identity, stops it, swaps in the clone, and restarts it. A commit that fails rolls back and releases the mute, so a failure never leaves live stranded dark. On deactivation the originals come back.
The clone is what makes this recoverable. Your original settings object is held by reference for the restore, and the restore path then sweeps the settings dictionary and re-registers the original if a clone leaked in, so replay values do not end up serialized over your real configuration.
If a plugin’s symbol cannot be resolved against the capture, that plugin is simply not routed. It keeps its own identity and receives nothing, rather than being silently pointed at the wrong symbol. The routing chip in the console is where you inspect and fix that.
Transport, and exactly when each control works
The transport is deliberately strict about when each button is live, so nothing is ever enabled-but-inert:
| Control | Enabled when |
|---|---|
| Play / Pause | A session is loaded AND its catalog scan has finished, the same gate as Restart. The icon becomes Restart once the file completes. |
| Stop | Playing, Paused, Completed or Error. Not in Ready or with no session. |
| Restart | A session is loaded and its catalog scan has finished. |
| Mark (add bookmark) | Playing or Paused only. |
| Jump (to a bookmark) | Exclusive replay mode is ON and a session is loaded (Ready, Playing, Paused or Completed). |
Stop is worth one extra sentence, because of how it works together with the mute. A clean Stop, or reaching end of file, with the exclusive toggle still on deliberately keeps the mute engaged. Routing survives transport events, and tiles hold their last replayed state instead of flickering back to live data. The mute is released when you switch the toggle off, on a fault stop, and on plugin teardown including the crash path.
Speed, and the honest readout
Eleven options, from -1000x to 1000x, defaulting to 1x. Positive values run faster than real time. Negative values are slow motion: internally -N maps to a factor of 1/N, so -10x plays at one tenth speed. Pacing is anchored to an absolute wall-clock target per message rather than sleeping the raw inter-message gap, so per-message processing cost is absorbed into the gap instead of accumulating as drift.
The readout next to the selector is the part worth watching. REQ is what you asked for. ACT is what the chain actually achieved, computed as data-time over wall-time, and it turns amber when the achieved factor falls below 80 percent of the requested one. That number is honest, and it is there because the pipeline has real ceilings. Our own instrumentation puts the single-threaded produce path through order-book maintenance at roughly 110,000 messages per second with no consumers attached; with the usual study set wired up the sustained figure is nearer 50,000 to 58,000. On the densest stretches of a busy tape the achieved figure settles below the request, and the readout reports the real rate the whole way through.
Bookmarks
The Mark button captures a bookmark at the current virtual timestamp, including enough book state to restore it, so you can re-run the same forty seconds of a liquidity event as many times as you need.
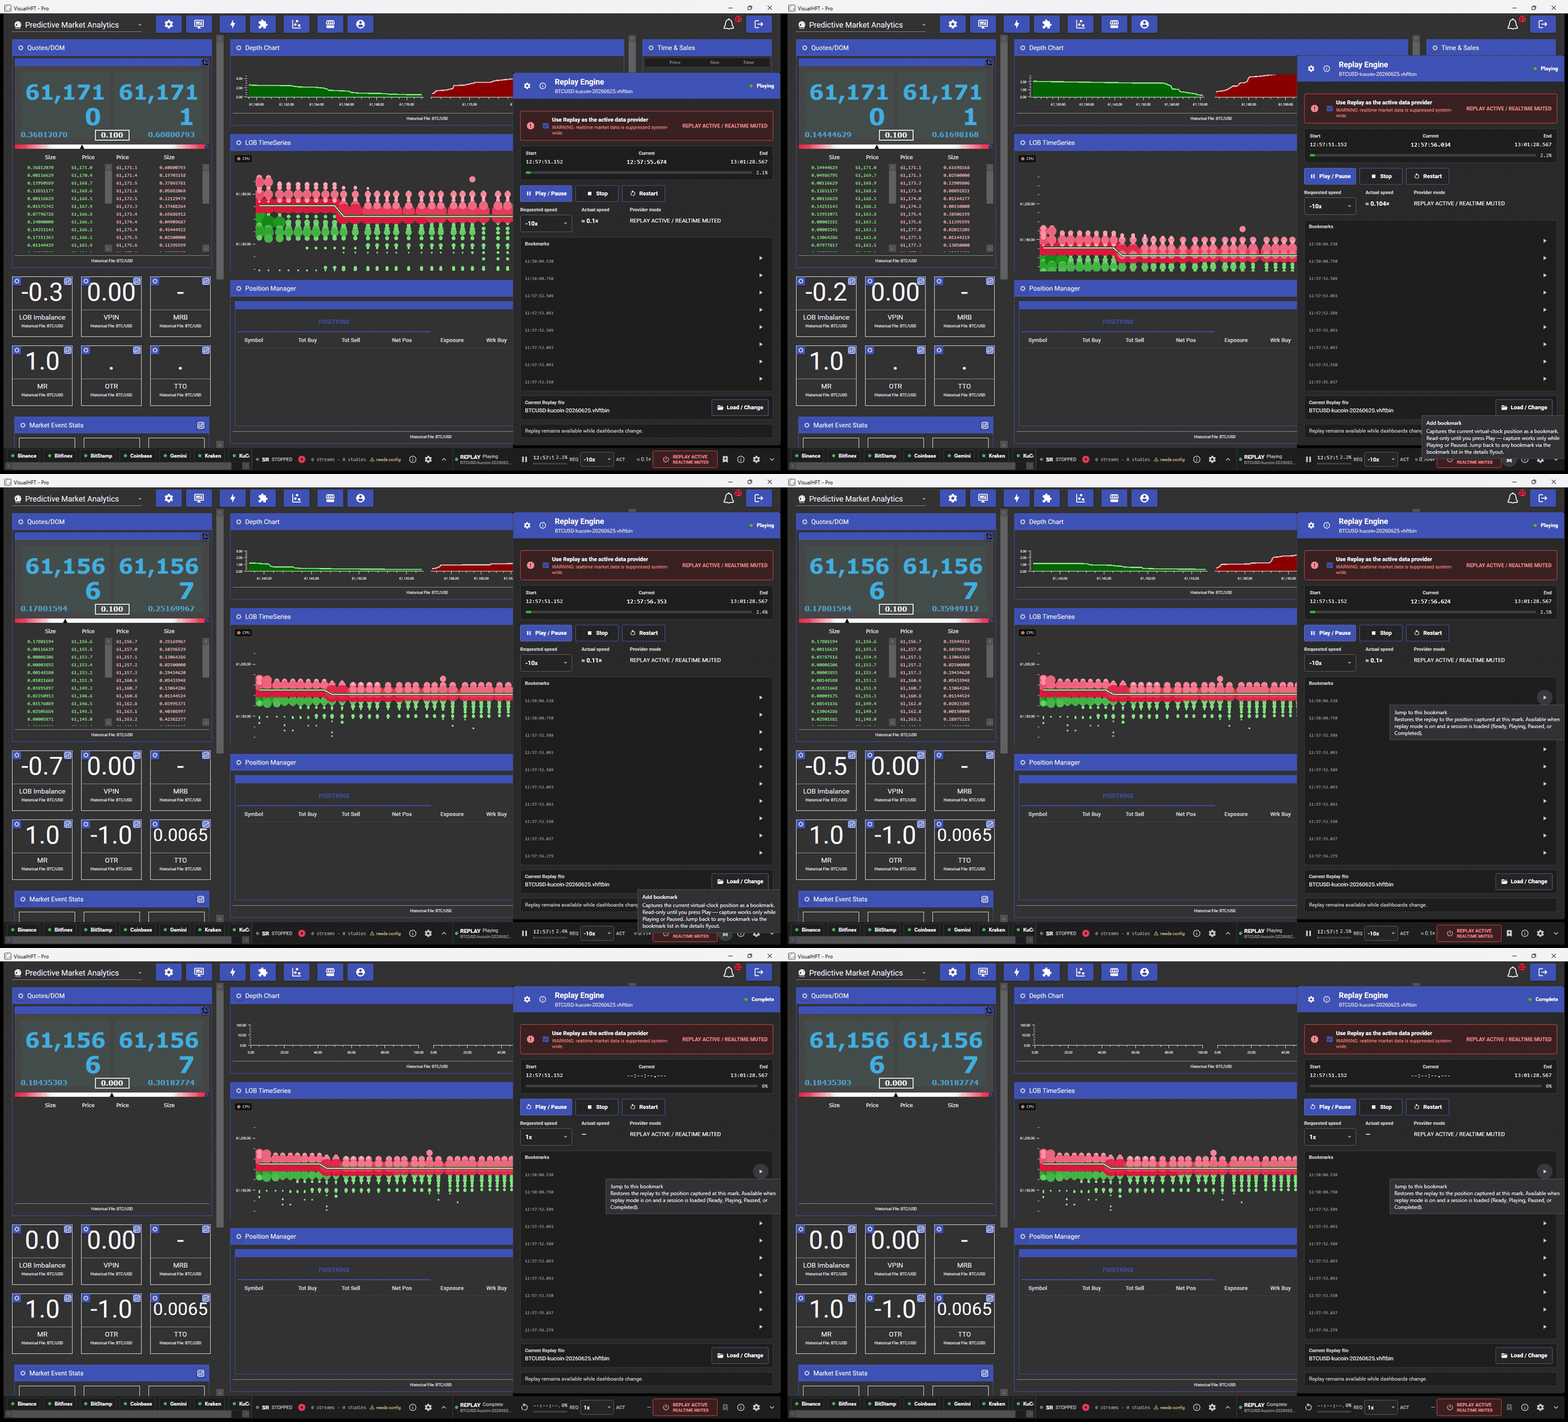
How the jump resumes depends on the format: pcap and FIX re-open the producer at the stored byte offset, and VHFT-BIN-1 reads its body in one pass so the restored virtual clock is the cut point. Bookmarks persist per capture in a keyed store under %LocalAppData%\VisualHFT\replay-bookmarks, so they survive a restart and follow the capture rather than the session.
The bookmark panel is never silently dead. When Jump is unavailable it says why, in words: “Enable replay mode (toggle) to use bookmarks” when a session is loaded but the toggle is off, and “Load a replay session to use bookmarks” otherwise.
What replay actually shows you
Tier: the Replay Engine is included with Pro. Every study named below is bundled too, from the Community tier upward, except market ratios, trade-to-order ratio, market event statistics and latency statistics, which need Core.
This is the whole point, and it deserves more than a feature list. Replaying a tape is not about watching a progress bar finish. It is about seeing microstructure happen at a speed your eyes can follow, on data where you already know what happened next.
Take the NASDAQ opening auction from Path A. Here is what the tape actually contains at that moment, measured rather than asserted. Scanning the first 300 MB of the T133000 segment covers roughly the first 39 seconds of the session and yields about 4.25 million ITCH messages across every instrument in the feed (the capture’s directory announces 11,328 of them), which is on the order of 109,000 messages per second at the bell. That is the burst rate; averaged over the segment’s full ten minutes it settles to about 34,000 per second. Filtered to AAPL alone, the window from 09:30:00 to 09:30:38 Eastern is 41,013 messages, roughly 1,100 per second:
| ITCH message | Count in the first 38 seconds |
|---|---|
| 33,303 | Add Order |
| 4,862 | Order Delete |
| 1,507 | Order Replace |
| 1,011 | Order Executed |
| 233 | Trade (non-cross) |
| 40 | Add Order with MPID attribution |
| 33 | Order Executed with price |
| 23 | Order Cancel (partial) |
| 1 | Cross Trade: the opening auction print |
That single 'Q' is the opening cross, and the bytes say so: its cross-type field is 'O', and it prints 587,385 shares at $177.0000 at 09:30:00 Eastern. VisualHFT surfaces it as a cross, and the timestamp together with the cross-type field tells you which one you are looking at. Everything around it is the queue forming, and that is the thing you can finally watch.
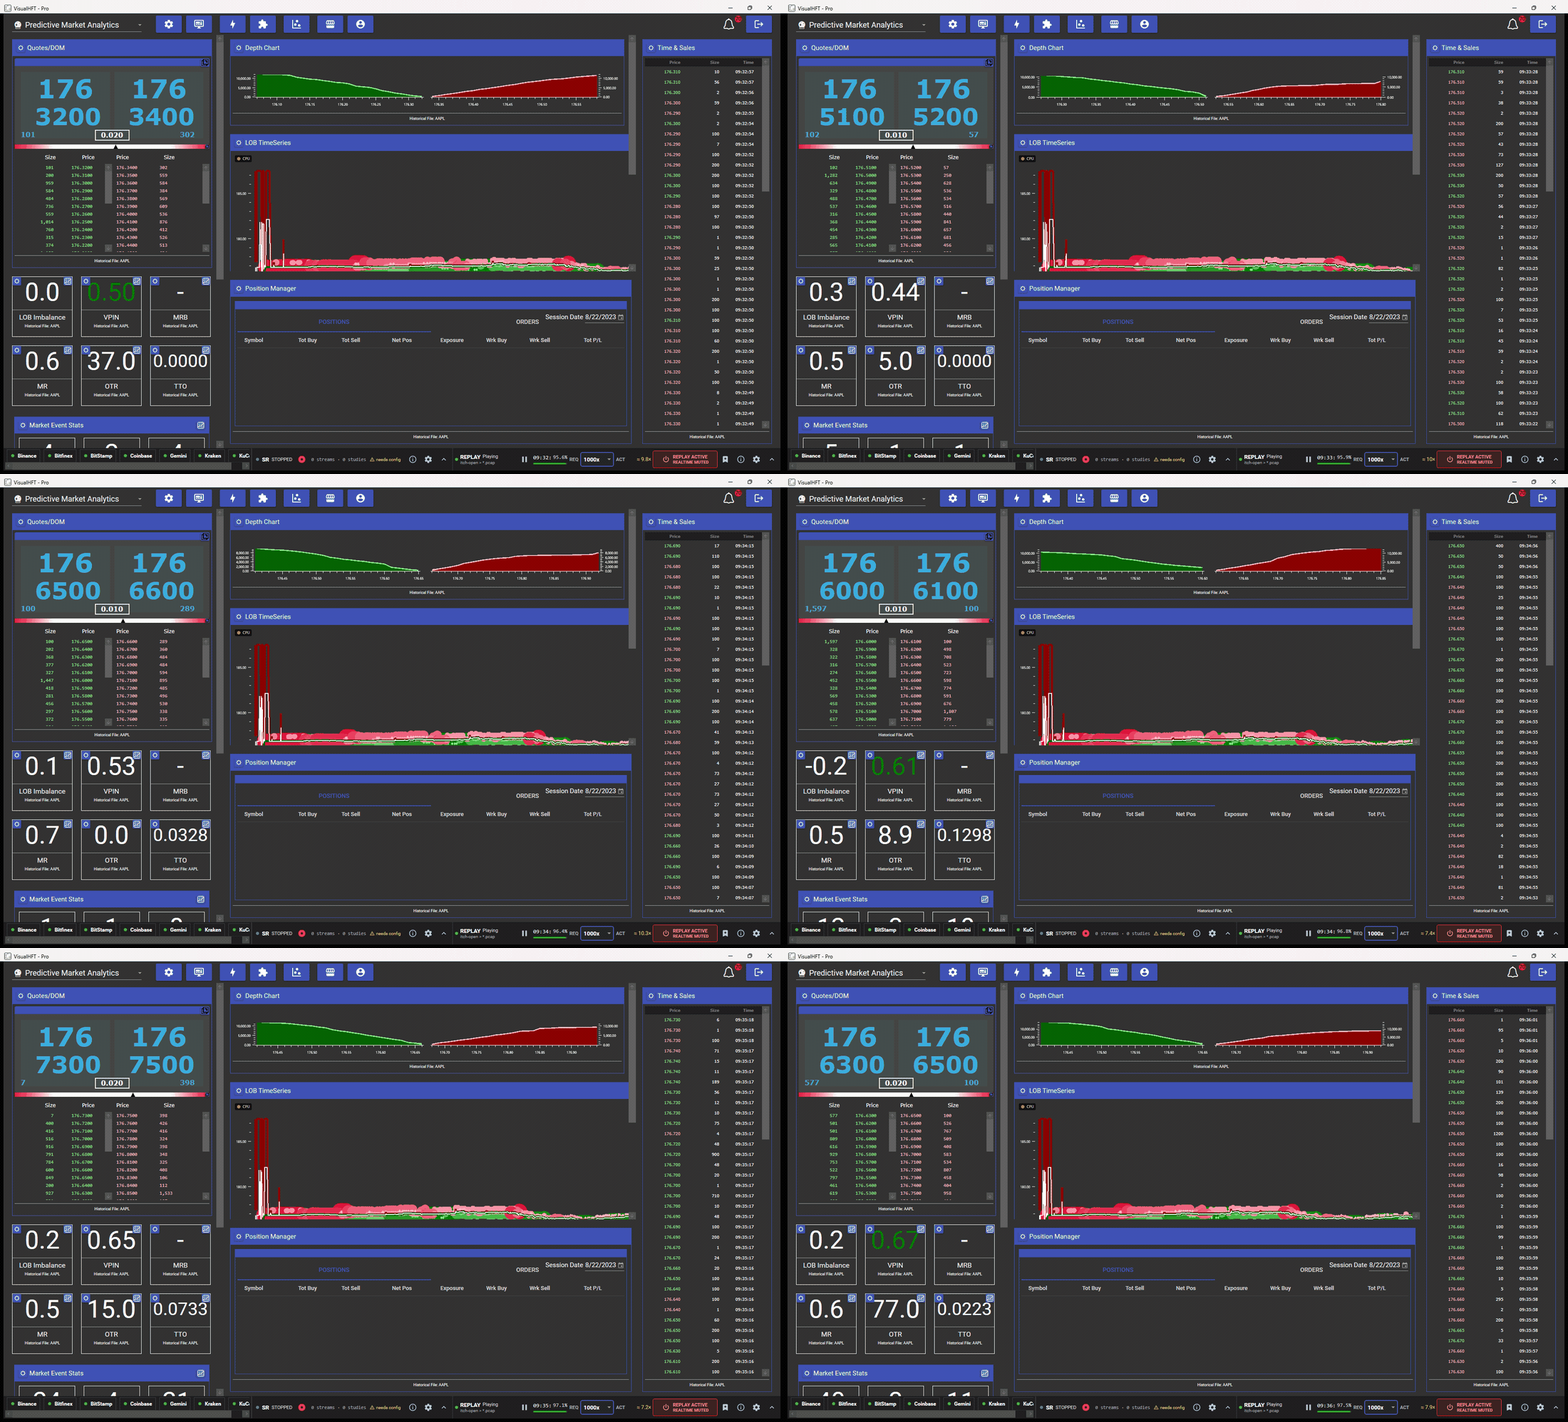
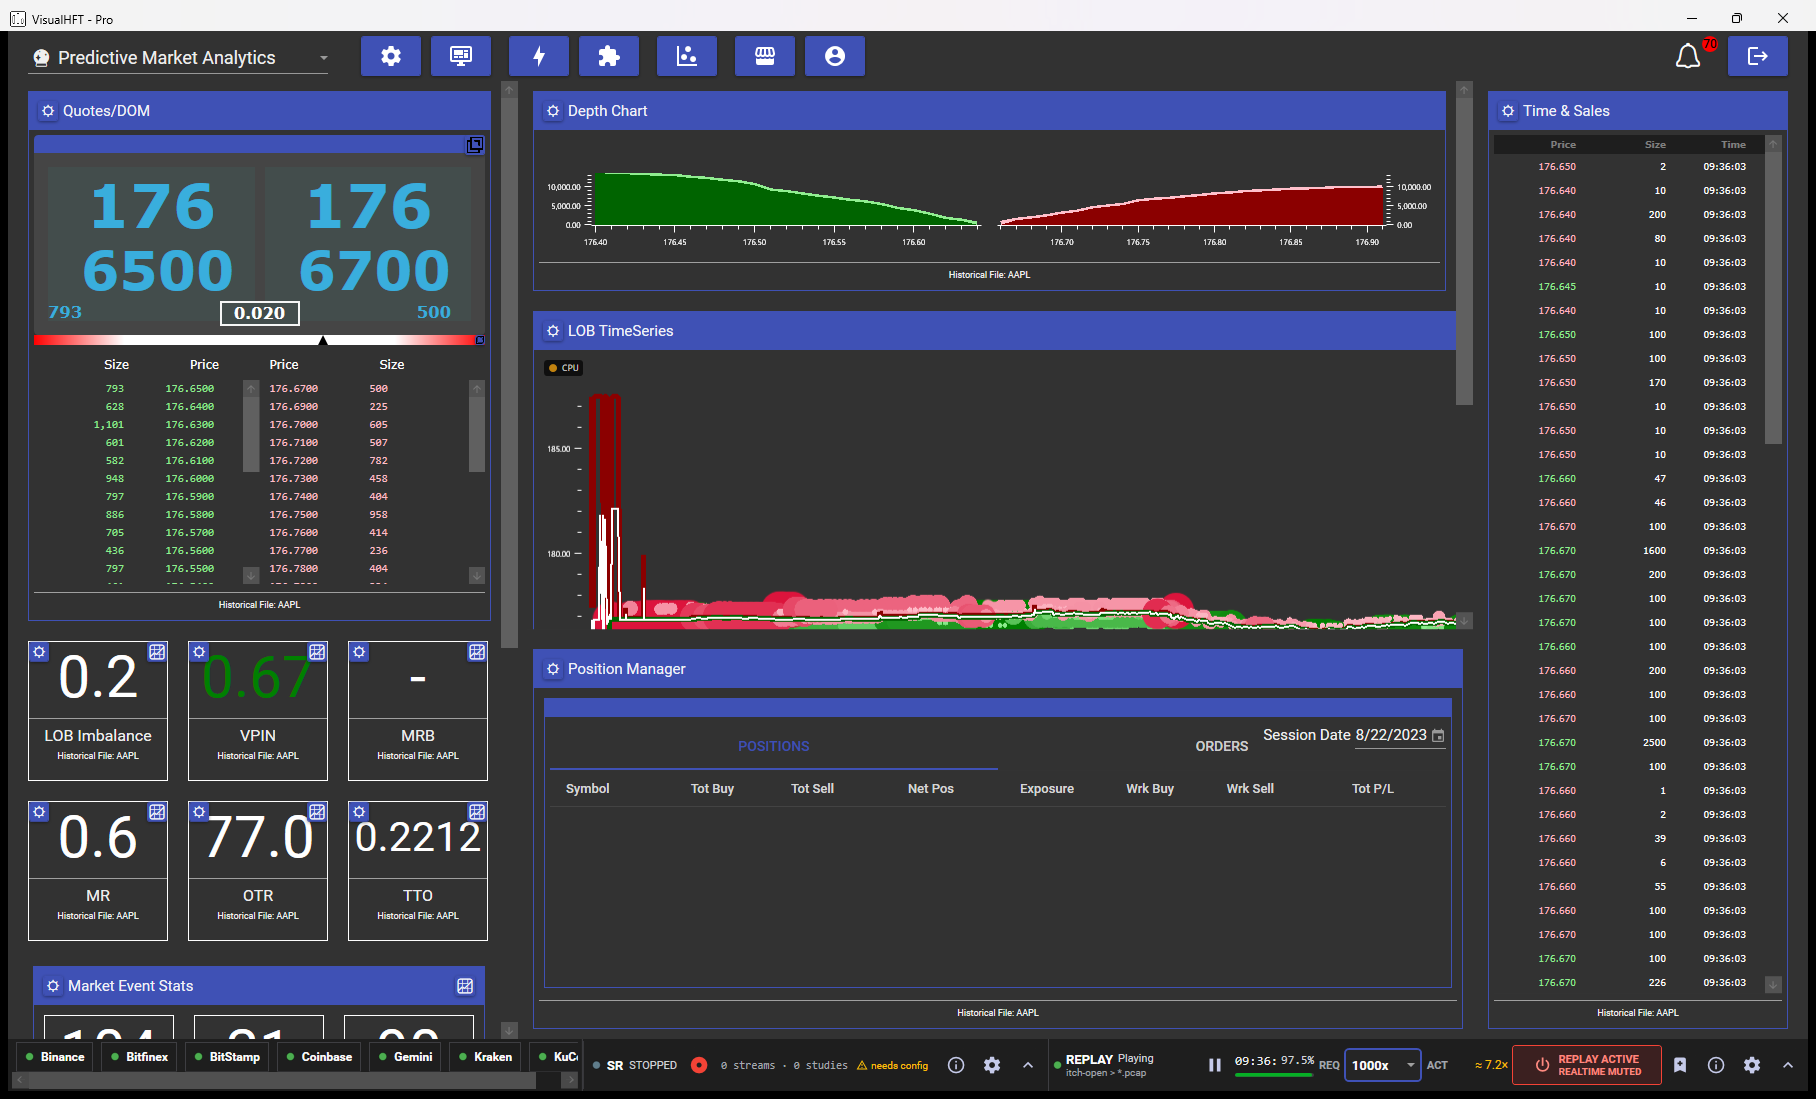
Here is a single frame of that, because several things in it are worth pointing at:
AAPL is quoted 176.65 by 176.67 with 793 and 500 at the touch. The Position Manager’s session date reads 8/22/2023, not today, because the virtual clock is the capture’s clock. Time and Sales is printing real AAPL executions. LOB Imbalance is 0.2, VPIN 0.67, Market Resilience 0.6, order-to-trade ratio 77.0.
And look at the transport: REQ 1000x with ACT ≈ 7.2x at 97.5 percent progress. That is the honest readout doing its job. The request was a thousand times real time; the chain delivered about seven, because the opening auction is the densest part of the tape and book maintenance is the ceiling. Nothing lied about it, and nothing silently dropped data to keep up.
Slow the same window down and specific behaviours become legible:
- Queue build-up before the bell. The depth chart fills from the touch outward as orders stack at the auction price. Because the LOB time series plots resting size as bubble area against price and time, a level that is accumulating looks visibly different from one that is being lifted.
- Book skew. LOB Imbalance is a single number on a tile, but during the ramp it swings hard and then reverts. Watching the tile and the depth chart together is what tells you whether the skew was real depth or a thin quote that evaporated on the first execution.
- The cancel storm. Order Delete and Order Replace together are over 6,300 of those 41,013 messages. Order-to-Trade Ratio and Market Event Stats put numbers on that in real time, which is exactly the signal that separates a genuine book from a quoted one.
- The print itself. Time and Sales shows the cross landing, and every trade-driven study steps at the same instant.
Everything on the dashboard participates, with no configuration beyond the routing step: the order book view, depth chart, LOB time series, and time and sales all render from replayed data, and the study plugins compute normally, including LOB Imbalance, VPIN, Market Resilience and its bias variant, order-to-trade and trade-to-order ratios, market event statistics, market ratios, and latency statistics.
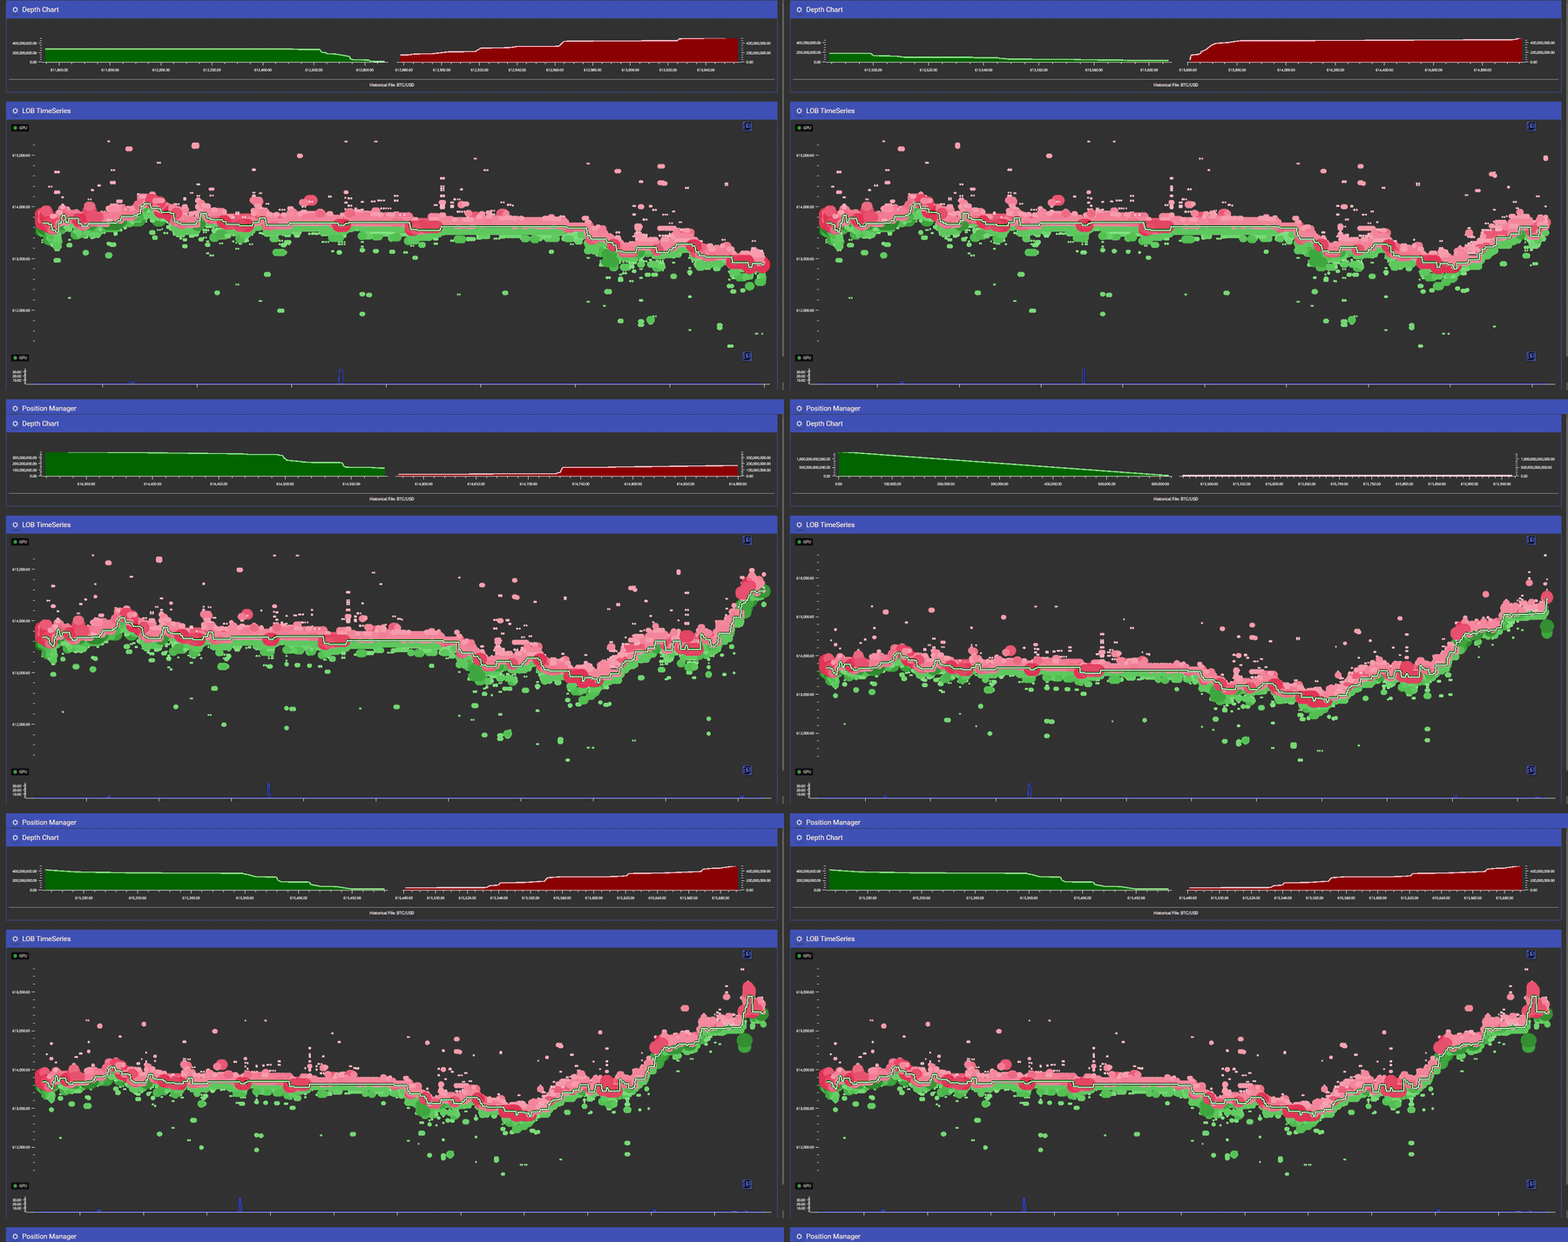
Time-dependent studies stay correct at speed because the virtual clock is advanced to each frame’s timestamp before that frame is dispatched, never after. VPIN’s volume buckets, Market Resilience’s shock timeouts, and every latency statistic read data time. This is tested with a rule that deliberately forbids introducing a mock clock seam, because the whole point is that studies read the same clock in replay as they do live. The Position Manager’s session date follows the capture too, so a replay of 25 June shows 25 June, not today.
TriggerEngine rules fire on replayed data as well. A routed study emits under the replay identity, and rules match on the plugin and the metric rather than on provider or symbol, so your existing alerting evaluates against the historical tape unchanged. That closes the loop: you can validate a rule against last Tuesday’s event before arming it on the live feed.
Getting the data back out
Tier: you need the Session Recorder add-on to RECORD the sessions, but not to export them. The exporter ships inside the bundled Replay Engine, so a
.vhftsesssomeone hands you exports fine on plain Pro.
Replay is one direction. The other direction matters just as much for research, and Session Recorder sessions export to CSV or Parquet in three shapes.
Long is a faithful event stream, and it produces three tables plus a schema sidecar: metric values, book levels, and trades. Wide gives one row per book frame with every metric column forward-filled to that frame, plus a per-metric as-of age in milliseconds so you always know how stale a carried-forward value is. WideBook is Wide plus the book itself flattened into columns, bid1..bidN and ask1..askN price and size per frame. That last one is the DeepLOB-style panel: full book state and the feature matrix in one record per timestamp.
Export runs in the app with progress and cancel, and there is a standalone CLI for batch work. Both --format and --shape take comma-separated lists, and every format-by-shape combination is written:
Tools.VhftExport <session.vhftsess> --format csv,parquet --shape long,wide,widebook --out <dir> [--stream <key>] [--depth <N>]Running that against a real recorded KuCoin BTC/USD session produced a long export split across three tables (171,894 metric observations across 2,173 distinct timestamps, plus the book and trade tables) and a 45-column WideBook panel of 1,948 rows, one per book frame, whose header reads:
book_ts_ns_utc,bid1_px,bid1_sz,ask1_px,ask1_sz, ... ,bid10_px,bid10_sz,ask10_px,ask10_sz,
value_LOB_Imbalance,asofage_ms_LOB_Imbalance,value_VPIN,asofage_ms_VPIN
That session also exercises the recovery path: it was interrupted before its footer was written. The exporter detected the truncation and exported the valid prefix, marking every output .partial in its file name. That suffix is the signal to look for. A crashed capture is still a usable dataset. The _long_book.csv and _long_trade.csv tables from a Long export, not the WideBook panel shown above, are the input to the Path D converter, which is a convenient way to check your converter against data VisualHFT itself produced. The aggressor column exports as unknown, following the same never-infer rule the converter contract sets out above.
Every export ships a JSON schema sidecar next to the data describing column types, fill methods, per-stream precision, and the conventions the reader needs. Two of those conventions are worth repeating, because they are what a downstream pipeline branches on: metric values are last-observation-carried-forward and never recomputed at export, and when a stream’s precision was not observable the sidecar sets PrecisionUnknown and the price and size columns hold raw integer ticks rather than decimals. The sidecar tells you which case you are in, per stream, so a downstream pipeline can branch on it instead of guessing.
What each path covers
Here is the scope of each path, so you can pick the right one first time:
- Whole-folder replay is the pcap path. VHFT-BIN-1 and VHFT-SESS-1 replay a single file, and FIX merges several files selected individually.
- Record one stream per session when you intend to replay it. The reader replays single-stream sessions and reports a clear error otherwise.
- Symbols come from the file header on VHFT-BIN-1 and VHFT-SESS-1, instantly, and FIX scans the body for tag 55. On the ITCH path you set the symbol yourself, exactly as it appears in the
Stockfield, and Play is ready straight away. - ITCH captures need their StockDirectory segment, and it must sort first in the directory.
- On a single-symbol ITCH replay, decoding is the constraint, not the order book. Per message our drill puts ITCH decoding at roughly 0.87 microseconds and 173 bytes, against 2.7 to 3.1 microseconds and 464 bytes for order-book maintenance. Book maintenance is the more expensive operation per message, but decoding is paid across every instrument on the tape, so on a single-symbol replay of an 11,328-instrument feed the aggregate decode cost sets the pace. That is what the achieved 7.2x on the auction above reflects.
- Exclusive replay mode mutes live feeds process-wide while it is engaged. That is the intended isolation, and a clean Stop deliberately keeps it engaged so routing survives transport events.
What you need
The Replay Engine is bundled with the Pro tier at no additional cost, and it covers Paths A, B and D in full. Session Recorder and Event Capture Recorder are separate paid add-ons on top of Pro, as is Microstructure Diagnostics, the transaction-cost-analysis surface that carries its own ingestion layer for execution logs (FIX, CSV, and JSON or JSONL, with a field-mapping dialog for arbitrary column names and venue presets for common schemas). Microstructure Diagnostics is a different ingest path from the Replay Engine and is documented separately.
If you have a tape you have never been able to inspect properly, the shortest path is: convert it to VHFT-BIN-1 with the script above, load it, engage exclusive mode, and press Play. The dashboard does not know the difference.
Related: Data, storage, and replay for the shorter operating procedure, and Advanced analysis guides for controlled GPU, latency and cross-venue investigations.