The Healthiest Tile on the Screen Is the One Doing Nothing
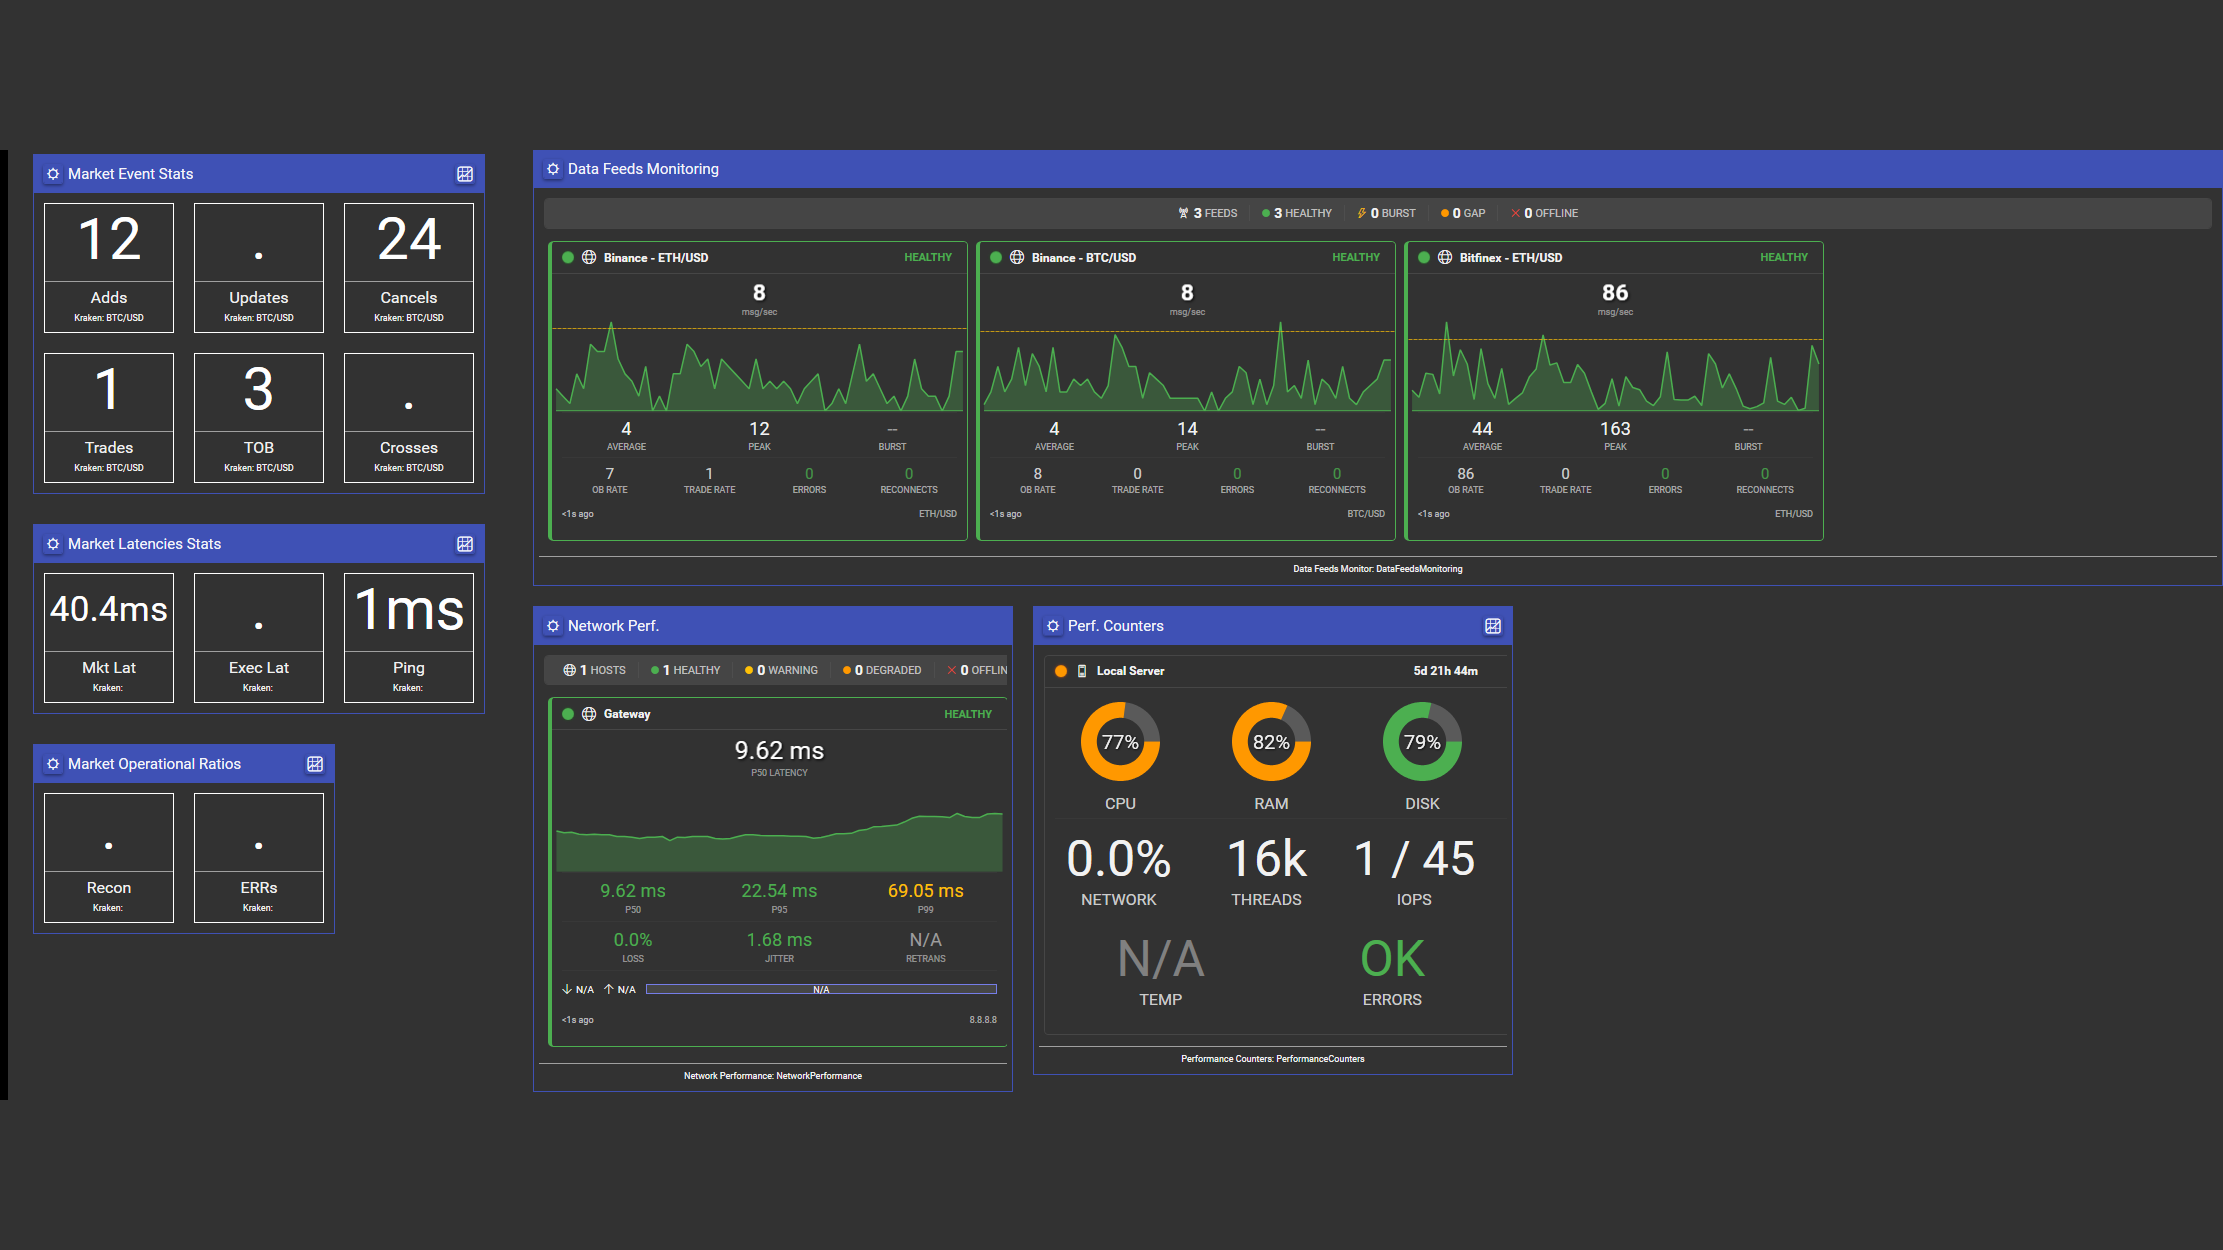
A feed starts to degrade. You have the message rate in front of you and the latency next to it, and both of them are telling you the same thing: something is wrong.
Neither of them tells you which kind of wrong. A session the connector keeps having to re-establish and a setup step that never completed produce a similar picture on a rate chart, and they need completely different responses. One is a conversation with the venue. The other is a book that started from an incomplete picture. Reading the rate harder does not separate them, because the rate is downstream of both.
The two counters that do separate them are the ones you have probably never looked at, for a reason that is easy to state: on a normal day they show nothing at all.
A counter whose healthy state is a blank
Reconnections and connector errors sit on their own tile. Both hold at a no-data dot until something happens, which means a still tile is the good news.
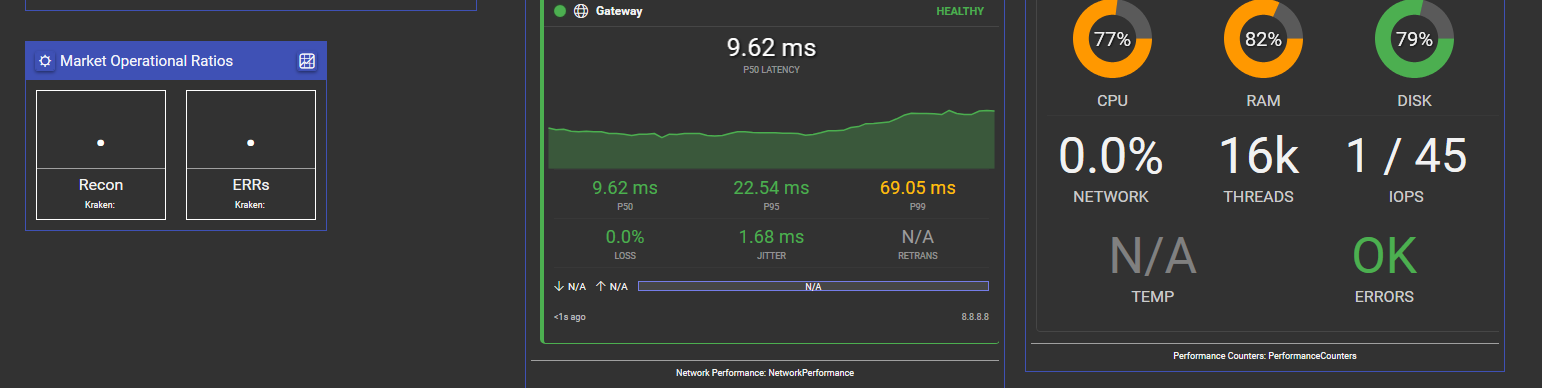
Both counters at rest, reporting venue wide, next to two panels that never stop moving.
That property is what makes the pair valuable, and what makes them worth a rule rather than a glance. A metric you watch continuously has to move to earn its place on a screen. A metric that stays blank until it matters earns its place in an alert instead.
The three readings
When a feed does degrade, read the two counters together against the feed rate. The combination is the diagnosis, and each combination has a shape you can learn to recognise at a glance.
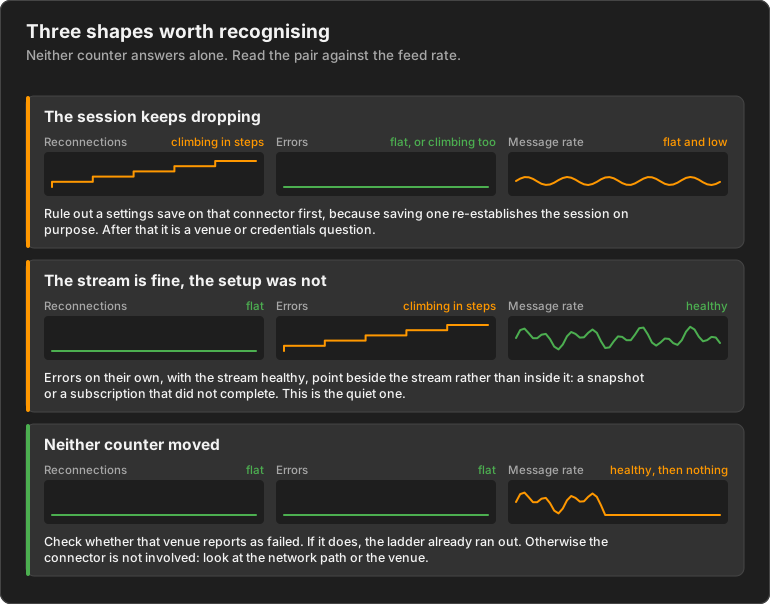
The middle case is the one worth internalising, because it is the one that does not announce itself. A failure on the live stream reconnects, so both counters move together and the rate sags: that shape is loud. A path that degraded shows up in latency percentiles. Errors moving while reconnections stay still is quieter than either, because the stream itself is healthy. It points at a step that runs beside the stream rather than inside it, a snapshot or a subscription that did not complete, which leaves the feed flowing normally on top of a book that started from an incomplete picture.
That is the case errors catch on their own, and it is the reason the pair beats either counter alone.
The ladder, and why it stops
The reconnection counter increments once per attempt, after the backoff delay has elapsed and immediately before the reconnect is tried. The backoff is exponential, two to the power of the attempt number in seconds, plus up to a second of jitter. Five attempts is the ceiling rather than a fixed sequence, and an incident can finish well short of it.
That gives the counter a shape worth recognising. An incident resolved on the first try adds one. An incident that runs the whole ladder adds five at widening intervals, about a minute end to end, after which the connector stops trying and reports the venue as failed rather than retrying into the evening.
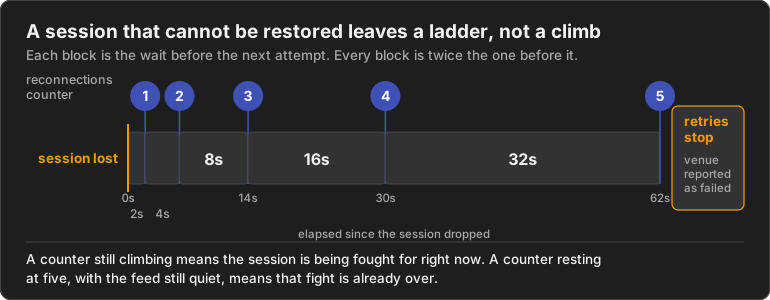
The practical consequence is a timing one, and it is about motion rather than any absolute reading, because the tile carries a running total for the day. A count still climbing tells you a session is being fought for right now. A count that has gone still, with the feed still quiet, tells you that fight is over and the connector is waiting for you. Read it twice about a minute apart, because that is roughly how long the whole ladder takes.
What each counter is for
A counter is only useful if a reading means something, so the two are kept to their own jobs rather than both collecting everything that goes wrong.
A clean shutdown is the clearest case. When a venue closes a session normally, that is reported as a disconnection rather than counted as a failure, because nothing about it is unexpected. An unexpected drop is the other case, and that is the one the reconnection counter records. Errors count the things that genuinely could not be read or completed, which is why an unexpected drop can raise one on its way into a reconnection.
The effect is a counter you can act on rather than one that is merely complete.
Pointing the tile at a venue takes two fields, a provider and an aggregation. There is no symbol to choose, because both counters report venue wide.
Make it a rule
Everything above argues for the same conclusion: this pair belongs in your alerting, not on your attention. Both counters are published to VisualHFT’s trigger engine and appear in its rule picker, so the rules live in the application alongside the dashboard rather than in separate monitoring tooling.
Two cover it, and both are as simple as rules get, because on a healthy desk these counters have nothing to say:
- Reconnections greater than zero. A session is being re-established. If you did not just save that connector’s settings, something ended it.
- Errors greater than zero. Correlate against the same venue’s feed card, and against the reconnection counter beside it. Errors moving together with reconnections is the live stream recovering. Errors moving on their own, with the rate healthy, points at a snapshot or subscription step rather than the stream. Errors while the feed is gapping points at the reconnect attempts themselves failing, which is the ladder running out.
Each rule fires an in-app alert or posts to an endpoint you nominate, with a cooldown so a flapping condition does not flood whatever is on the other side. Write them for the same reason the tile is easy to forget: the failures they catch happen while nobody is looking at the screen.
Where this lives
Market Operational Ratios is one of the six plugins on VisualHFT’s Infrastructure Monitoring dashboard. It is bundled, included with a Core plan, and it ships in the installer. Both counters are raised from shared paths inside the connector base class, so every venue connector feeds them with no per venue setup.
The full write up, with every measurement defined, the settings and their accepted ranges, and the diagnostic playbook for each situation the dashboard was built around: