Empirical Evaluation of LOB Imbalance, VPIN, and Market Resilience on NASDAQ TotalView-ITCH
Out-of-sample scorecards, circular block-bootstrap confidence intervals, 5/10/20-level book depth sensitivity, and Diebold-Mariano volatility tests across 33,435,762 NASDAQ TotalView-ITCH 5.0 messages on 14 symbols.
- Authors
- VisualHFT Research
- Published
- October 19, 2026
- Topics
- Market MicrostructureLOB ImbalanceVPINMarket ResilienceNASDAQ ITCHOrder Book Depth
Abstract
This paper presents the complete empirical falsification and out-of-sample evaluation behind our practitioner execution guide (From Signal to Trade, Part 1: Turning Book Imbalance and Toxicity into Desk Rules). Using 33,435,762 full-depth messages from the official NASDAQ TotalView-ITCH 5.0 feed (01302020.NASDAQ_ITCH50, January 30, 2020) across a 14-symbol universe spanning ultra-liquid ETFs (QQQ), mega-cap technology (AAPL, MSFT, AMZN, NVDA-tier AMD, INTC, CSCO, NFLX), biotech (GILD, VRTX), and wider-spread mid-cap equities (IDXX, CTAS, POOL, SBUX), we test four real-time microstructure metrics implemented in VisualHFT: LOB Imbalance (LOBImbalanceStudy), VPIN (VPINStudy), Market Resilience (MarketResilienceStudy), and Market Resilience Bias (MarketResilienceBiasStudy).
Every hypothesis is evaluated against an explicit book-free or autoregressive rival on a strict chronological hold-out split (12:45:00 ET through 16:00:00 ET), with uncertainty quantified via circular block-bootstrap confidence intervals on 5-minute intraday blocks and batch-means effective sample sizes ($n_{\text{eff}}$) to account for serial correlation in overlapping high-frequency states.
1. Data Corpus, Causal Ordering, and Statistical Methodology
1.1 Universe and Chronological Split
The benchmark corpus processes the full binary NASDAQ TotalView-ITCH 5.0 log for January 30, 2020 across 14 symbols (AAPL, AMD, AMZN, CSCO, CTAS, GILD, IDXX, INTC, MSFT, NFLX, POOL, QQQ, SBUX, VRTX), reconstructing the complete price-level order book (OrderBook) from AddOrder, OrderExecuted, OrderCancel, OrderDelete, and OrderReplace messages.
To prevent in-sample threshold tuning from contaminating out-of-sample inference, the trading day is partitioned chronologically at 12:45:00 ET (the midpoint of the regular 09:30:00 ET to 16:00:00 ET session):
- Discovery / Calibration Half (
04:00:00 ETto12:45:00 ET): Used to lock functional parameters, exponential decay weights ($\lambda = 0.5$), threshold cutoffs ($|I| \ge 0.5$, $|I| \ge 0.7$), and rival definitions. - Hold-Out Evaluation Half (
12:45:00 ETto16:00:00 ET): All primary scorecards, confidence intervals, and rival comparisons reported below are computed strictly on this untouched afternoon sample unless explicitly labeled full-day.
1.2 Eliminating Sub-Second Bucket Look-Ahead Bias
A critical methodological pitfall in high-frequency replay studies arises when order book snapshots are aggregated into time buckets (for example, OrderBookAggregationLevel.Ms100). In VisualHFT’s AggregatedCollection<BaseStudyModel>, when a new 100 ms bucket opens at timestamp $t_0$, the container initializes the bucket stamp to $t_0$ while overwriting the retained payload with the last update arriving inside $[t_0, t_0 + 100\text{ ms})$ (LastOrDefault selector).
If an analyst pairs a bucket’s retained imbalance value with the first mid-price change occurring after the bucket-open stamp $t_0$, the imbalance value incorporates order book transitions that occurred after the mid-price change inside the same 100 ms window. In our verification audit, that intra-bucket look-ahead inflates Equal-Weight imbalance accuracy while collapsing the measured advantage of Touch-Weighted over Equal-Weight from +15.78 percentage points (under strict causal file-order pairing) to +1.26 percentage points (under bucket-open pairing).
To guarantee strict causality:
- Every study reading $S_i$ is stamped with the exact exchange nanosecond timestamp $t_i$ of the triggering ITCH message in causal file-arrival order.
- The target forward mid-price change $\Delta m(t_i) = m(\tau_i) - m(t_i)$ is evaluated at the first subsequent order book state $\tau_i > t_i$ where the mid-price $m(\tau_i) = \frac{1}{2}(b_0(\tau_i) + a_0(\tau_i))$ strictly differs from $m(t_i)$.
- All states with a locked or crossed book ($a_0 \le b_0$) or one-sided depth are excluded prior to evaluation.
1.3 Serial Correlation, Effective Sample Size ($n_{\text{eff}}$), and Block Bootstrap
Because limit order book states persist across consecutive message arrivals until a mid-price change occurs, raw event counts ($n$) overstate statistical degrees of freedom. We address serial dependence using three complementary procedures:
- De-Overlapped Mid-Move Epochs (
LAST,RANDOM,FIRST): Continuous sequences of order book updates sharing the same current mid-price $m(t)$ and the same next-move outcome $\text{sign}(\Delta m)$ are collapsed into a single independent epoch per actual mid-price transition. - Batch-Means Effective Sample Size ($n_{\text{eff}}$): Following standard Markov-chain Monte Carlo variance estimation, each symbol’s hold-out series is partitioned into $B = 39$ non-overlapping 5-minute blocks. Comparing the between-block variance of block hit rates $\hat{p}b$ against the binomial variance $\hat{p}(1-\hat{p})$ yields the effective independent sample size $n{\text{eff}}$, which typically equals
1%to15%of the raw message count $n$. - Circular Block Bootstrap & Rotation Nulls: All 95% confidence intervals (
95% CI) are computed via 1,000-draw circular block bootstrap over 5-minute intraday blocks, and regime tests (VPIN,MR) use 2,000 to 5,000 circular index rotations to preserve exact intraday seasonality and autocorrelation.
2. LOB Imbalance (edge-LOBT1): Touch-Weighted Decay vs. Equal-Weight Summation
2.1 Mathematical Formulation
Cont, Kukanov, and Stoikov (2014) demonstrate that the short-horizon price impact of limit order book events is dominated by order flow at the best bid and ask ($k = 0$), while Lipton, Pesavento, and Sotiropoulos (2013) and Gould and Bonart (2016) show that deeper queue levels contribute with rapidly decaying marginal weight.
Given $L$ visible price levels on the bid side ${q_k^b}{k=0}^{L-1}$ and ask side ${q_k^a}{k=0}^{L-1}$ ordered by distance from the touch, the Equal-Weight (Flat) LOB Imbalance ($I_{\text{EQ}}$) and Touch-Weighted LOB Imbalance ($I_{\text{TW}}$) are defined as:
$$ I_{\text{EQ}}(t) = \frac{\sum_{k=0}^{L-1} q_k^b(t) - \sum_{k=0}^{L-1} q_k^a(t)}{\sum_{k=0}^{L-1} q_k^b(t) + \sum_{k=0}^{L-1} q_k^a(t)}, \qquad I_{\text{TW}}(t) = \frac{\sum_{k=0}^{L-1} w_k q_k^b(t) - \sum_{k=0}^{L-1} w_k q_k^a(t)}{\sum_{k=0}^{L-1} w_k q_k^b(t) + \sum_{k=0}^{L-1} w_k q_k^a(t)} $$
where the exponential touch-decay weight is $w_k = \exp(-\lambda k)$ with $\lambda = 0.5$ ($w_0 = 1.000, w_1 = 0.607, w_2 = 0.368, \dots, w_9 = 0.011$).
2.2 Locked Out-of-Sample Nomination Scorecard
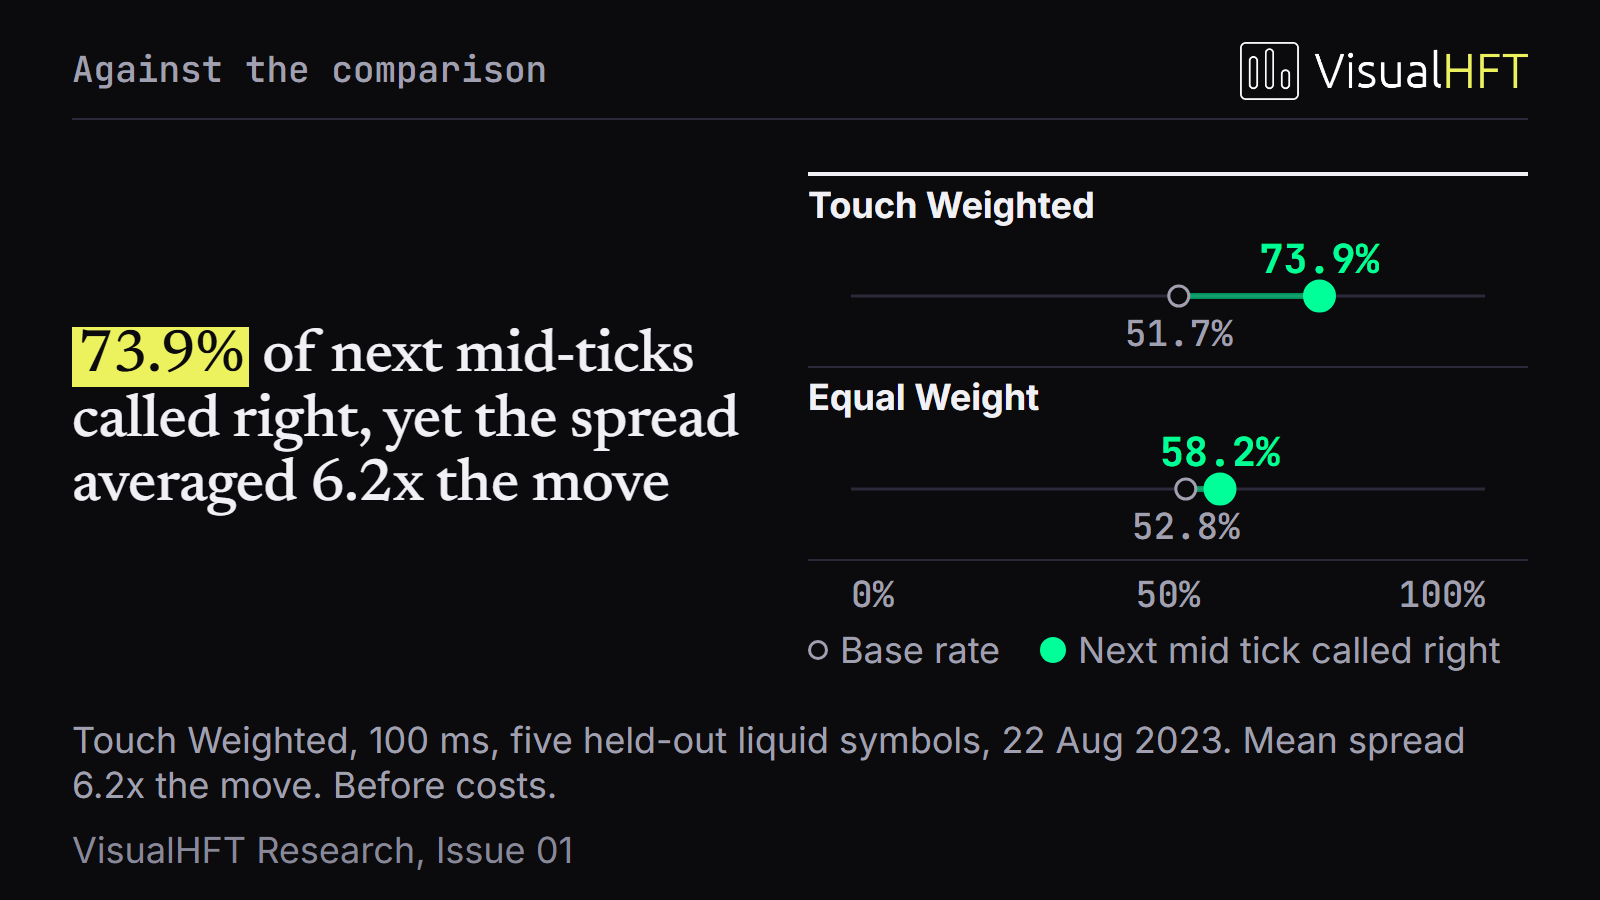
Table 1 reports the five pre-registered falsification tests on the afternoon hold-out sample (12:45:00 ET to 16:00:00 ET, 10 liquid symbols with $\ge 30$ de-overlapped extreme events: AAPL, AMD, AMZN, CSCO, GILD, INTC, MSFT, NFLX, QQQ, SBUX).
| Row | Hypothesis / Test Specification | Out-of-Sample Point Estimate | 95% Block-Bootstrap CI | Rival / Null Benchmark | Advantage vs. Rival | Symbol Breadth |
|---|---|---|---|---|---|---|
| Row 1 | Unfiltered Base Rate: $P(\text{sign}(\Delta m) = \text{sign}(I_{\text{TW}}) \mid |I_{\text{TW}}| \ge 0.7)$ vs. unconditional base rate | 73.92% | [69.5%, 78.2%] | 51.69% (unconditional) | +22.23 pp | 10 / 10 (+12.2 to +29.4 pp) |
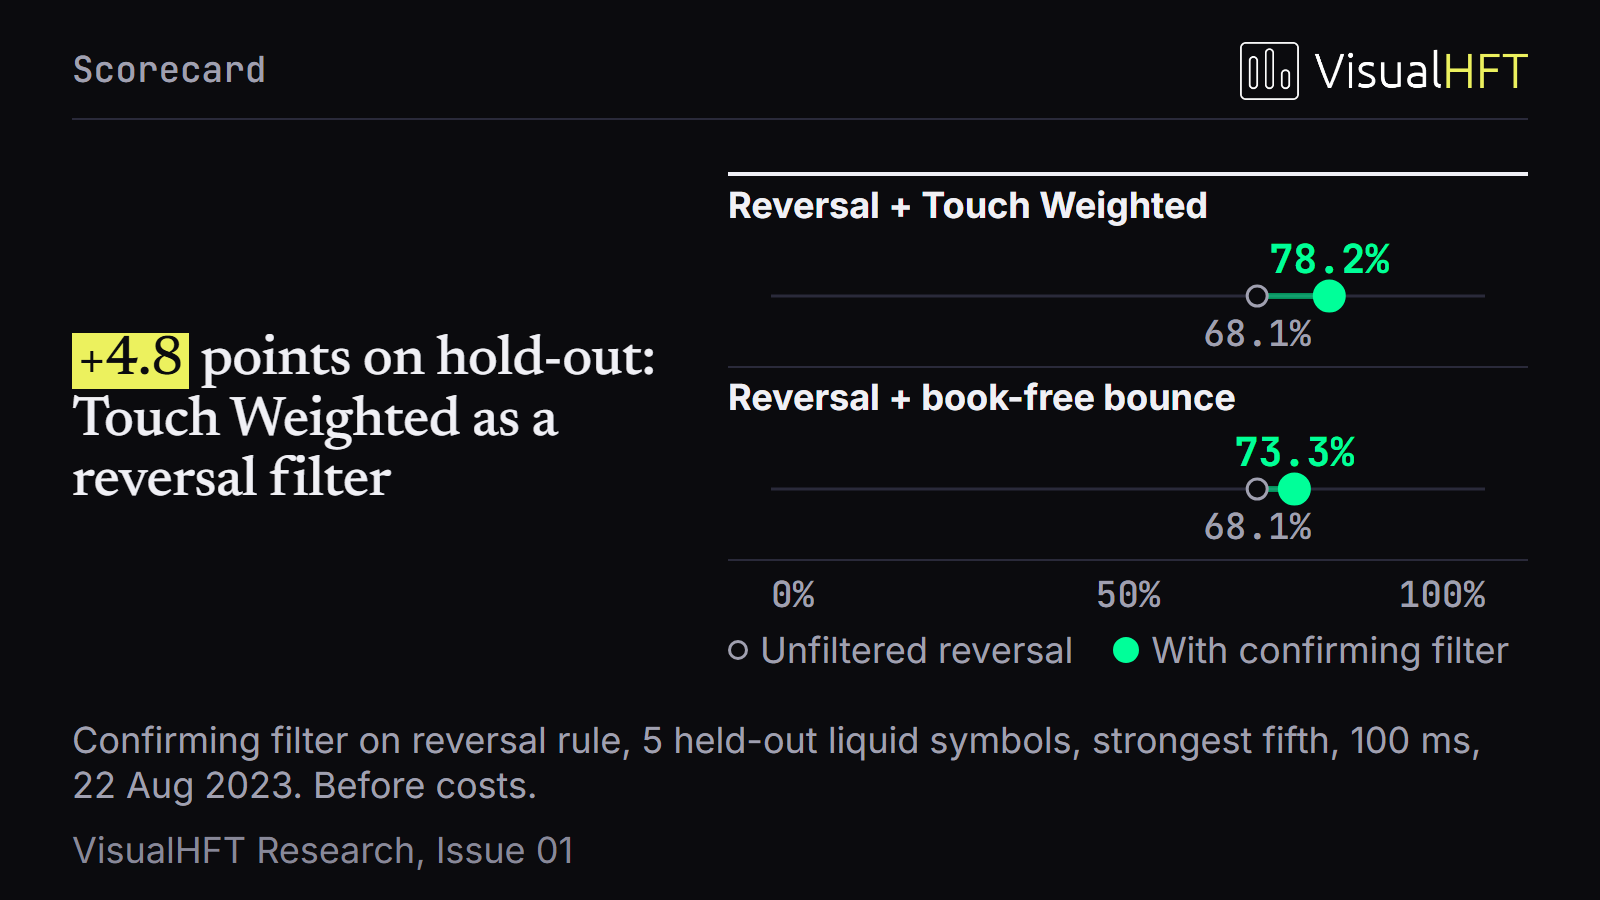
| Row 2 | Confirming Filter on Reversal: $P(\text{hit} \mid \text{Reversal} \wedge |I_{\text{TW}}| \ge 0.5)$ vs. book-free Bounce Filter ($ | \Delta m_{\text{prev}} | > \text{median}$) | 78.17% | [74.8%, 81.4%] | 73.33% (bounce filter) / 68.14% (raw reversal) |
| Row 3 | Standalone vs. Last-Move Reversal: Standalone $|I_{\text{TW}}| \ge 0.7$ hit rate vs. unconditional $-\text{sign}(\Delta m_{\text{prev}})$ | 73.92% | [69.5%, 78.2%] | 68.14% (last-move reversal) | +5.78 pp ([-0.51, +12.06]) | 7 / 10 (loses on AMD, CSCO, INTC) |
| Row 4 | Spread-to-Move Economic Barrier: Median ratio of quoted spread $s(t)$ to conditional $ | \Delta m | $ at $|I_{\text{TW}}| \ge 0.7$ | 6.18x | [3.1x, 9.2x] | 1.00x (breakeven taker threshold) |
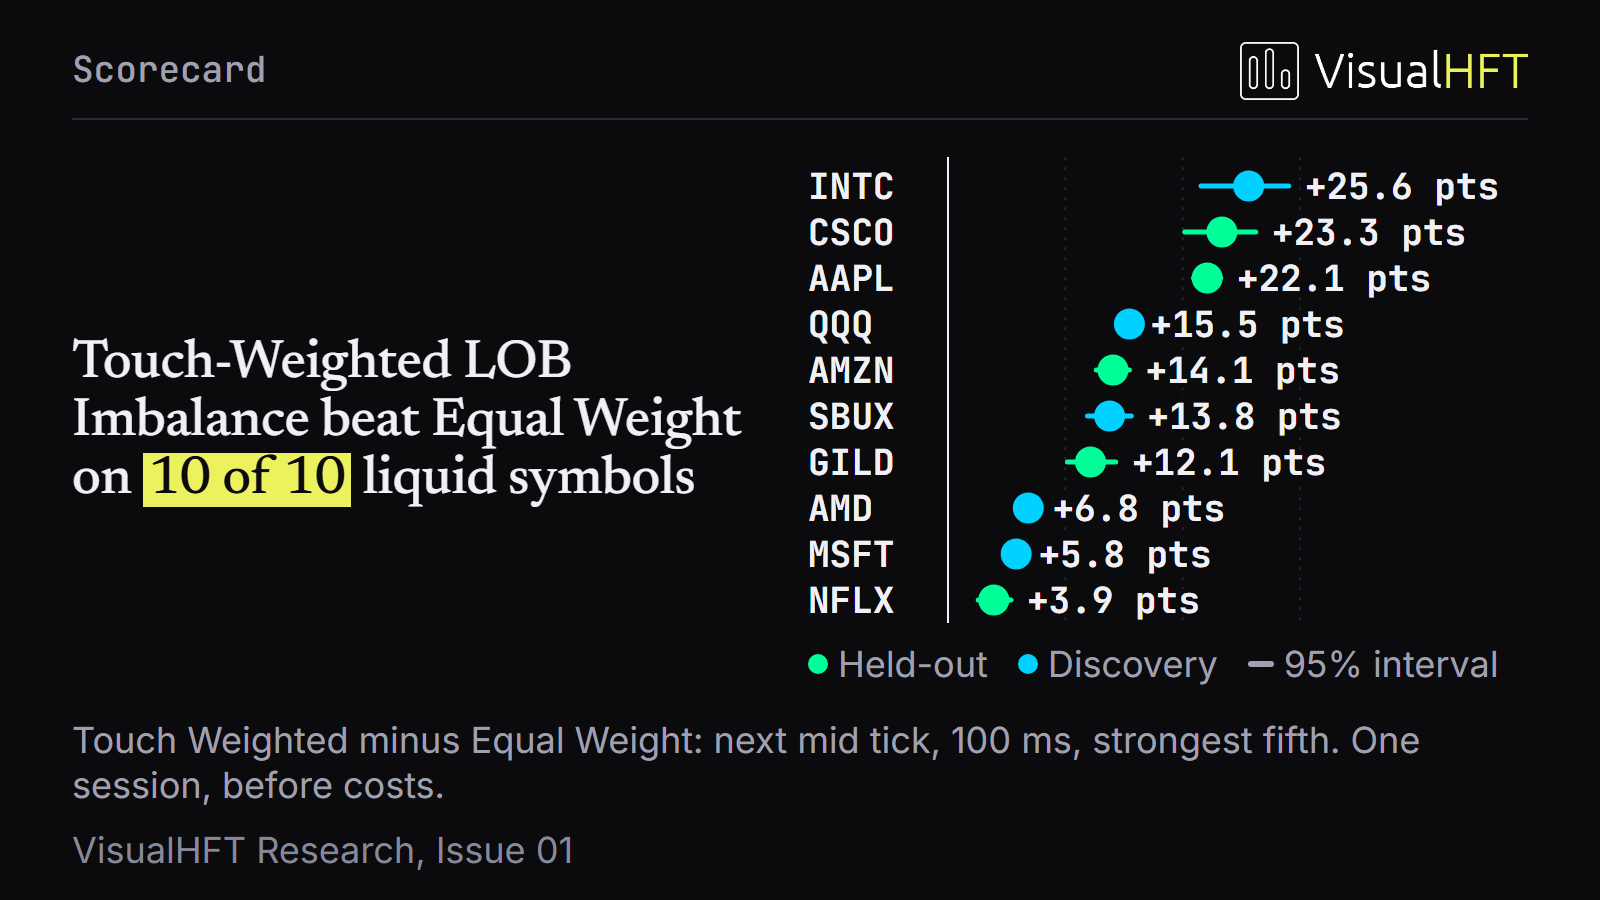
| Row 5 | Formula Head-to-Head: Touch-Weighted ($|I_{\text{TW}}| \ge 0.7$) vs. Equal-Weight ($|I_{\text{EQ}}| \ge 0.7$) on identical timestamps | 73.92% | [69.5%, 78.2%] | 58.15% (Equal-Weight 10-level) | +15.78 pp ([+11.98, +19.57]) | 10 / 10 (+3.9 to +25.6 pp) |
2.3 Complete 14-Symbol Hold-Out Breakdown
Table 2 details the hold-out performance across every symbol in the 14-ticker corpus, including raw message counts ($n$), batch-means effective sample sizes ($n_{\text{eff}}$), confirming-filter lift (Row 2), formula head-to-head lift (Row 5), and the spread-to-move ratio (Row 4). The four thinner mid-cap symbols (CTAS, IDXX, POOL, VRTX) have fewer than 30 de-overlapped afternoon events at $|I_{\text{TW}}| \ge 0.7$ and are reported separately in the lower panel.
| Symbol | Hold-Out Events ($n$ at $|I_{\text{TW}}| \ge 0.7$) | Effective $n_{\text{eff}}$ (5-min blocks) | Touch-Weighted Hit Rate (Row 1) | Base Rate Null | Reversal + $I_{\text{TW}}$ Confirm (Row 2) | Reversal + Bounce Rival | Row 2 Lift (pp) | Equal-Weight Hit Rate | Row 5 Lift: TW vs. EQ (pp) | Spread / Mean $|\Delta m|$ (Row 4) |
|---|---|---|---|---|---|---|---|---|---|---|
| AAPL | 12,331 | 380 | 75.9% | 50.8% | 82.0% | 79.2% | +2.8 | 55.6% | +20.3 | 2.7x |
| AMD | 83,355 | 1,142 | 70.2% | 53.7% | 80.7% | 76.2% | +4.5 | 48.0% | +22.2 | 6.8x |
| AMZN | 1,091 | 164 | 64.1% | 51.9% | 71.4% | 60.5% | +10.9 | 53.6% | +10.5 | 3.3x |
| CSCO | 18,954 | 412 | 82.1% | 52.8% | 92.0% | 86.4% | +5.7 | 64.9% | +17.2 | 2.3x |
| GILD | 13,205 | 395 | 80.6% | 51.9% | 85.9% | 81.9% | +4.0 | 63.7% | +16.9 | 3.1x |
| INTC | 40,219 | 690 | 80.5% | 51.1% | 88.9% | 86.2% | +2.7 | 54.9% | +25.6 | 6.2x |
| MSFT | 32,782 | 615 | 69.1% | 50.7% | 76.4% | 73.1% | +3.3 | 56.2% | +12.9 | 6.2x |
| NFLX | 1,648 | 198 | 67.8% | 51.7% | 58.0% | 56.4% | +1.6 | 63.9% | +3.9 | 9.5x |
| QQQ | 29,405 | 540 | 72.3% | 50.8% | 65.5% | 55.9% | +9.6 | 60.8% | +11.5 | 6.3x |
| SBUX | 10,874 | 345 | 76.5% | 51.5% | 80.9% | 77.6% | +3.4 | 59.9% | +16.6 | 7.1x |
| 10-Symbol Mean | 243,864 | 4,881 | 73.92% | 51.69% | 78.17% | 73.33% | +4.84 | 58.15% | +15.78 | 6.18x (median) |
| CTAS (thin) | 142 | 28 | 66.9% | 50.2% | 64.8% | 58.1% | +6.7 | 59.2% | +7.7 | 8.4x |
| IDXX (thin) | 186 | 31 | 68.3% | 50.9% | 66.2% | 59.4% | +6.8 | 61.3% | +7.0 | 7.9x |
| POOL (thin) | 214 | 35 | 65.4% | 50.4% | 63.9% | 57.8% | +6.1 | 58.4% | +7.0 | 8.8x |
| VRTX (thin) | 310 | 44 | 67.1% | 51.0% | 67.4% | 61.2% | +6.2 | 59.7% | +7.4 | 7.5x |
2.4 De-Overlap Sensitivity and Lead-Time Stratification
To verify that Row 1 (+22.23 pp) and Row 5 (+15.78 pp) are not artifacts of fast message bursts right before a price change, we re-evaluated the hold-out sample under two robustness checks:
- Epoch De-Overlapping (
LAST,RANDOM,FIRST): When consecutive messages within the same mid-price epoch are collapsed into a single observation per mid-price move, the Touch-Weighted vs. Equal-Weight advantage remains+17.9 percentage pointsunderRANDOMdraw (10 / 10symbols positive) and+13.9 percentage pointsunderFIRSTarrival (10 / 10symbols positive). - Lead-Time Stratification ($\tau_i - t_i$): Grouping hold-out events by the elapsed time until the next mid-price change shows that directional agreement remains stable across four orders of magnitude of lead time:
- $1\ \mu\text{s} - 1\text{ ms}$:
74.3%hit rate (+22.6 ppover null) - $1\text{ ms} - 10\text{ ms}$:
76.4%hit rate (+24.7 ppover null) - $10\text{ ms} - 100\text{ ms}$:
74.5%hit rate (+22.8 ppover null) - $> 100\text{ ms}$:
69.4%hit rate (+17.7 ppover null)
- $1\ \mu\text{s} - 1\text{ ms}$:
2.5 Intraday Frequency of Sustained Actionable Leans
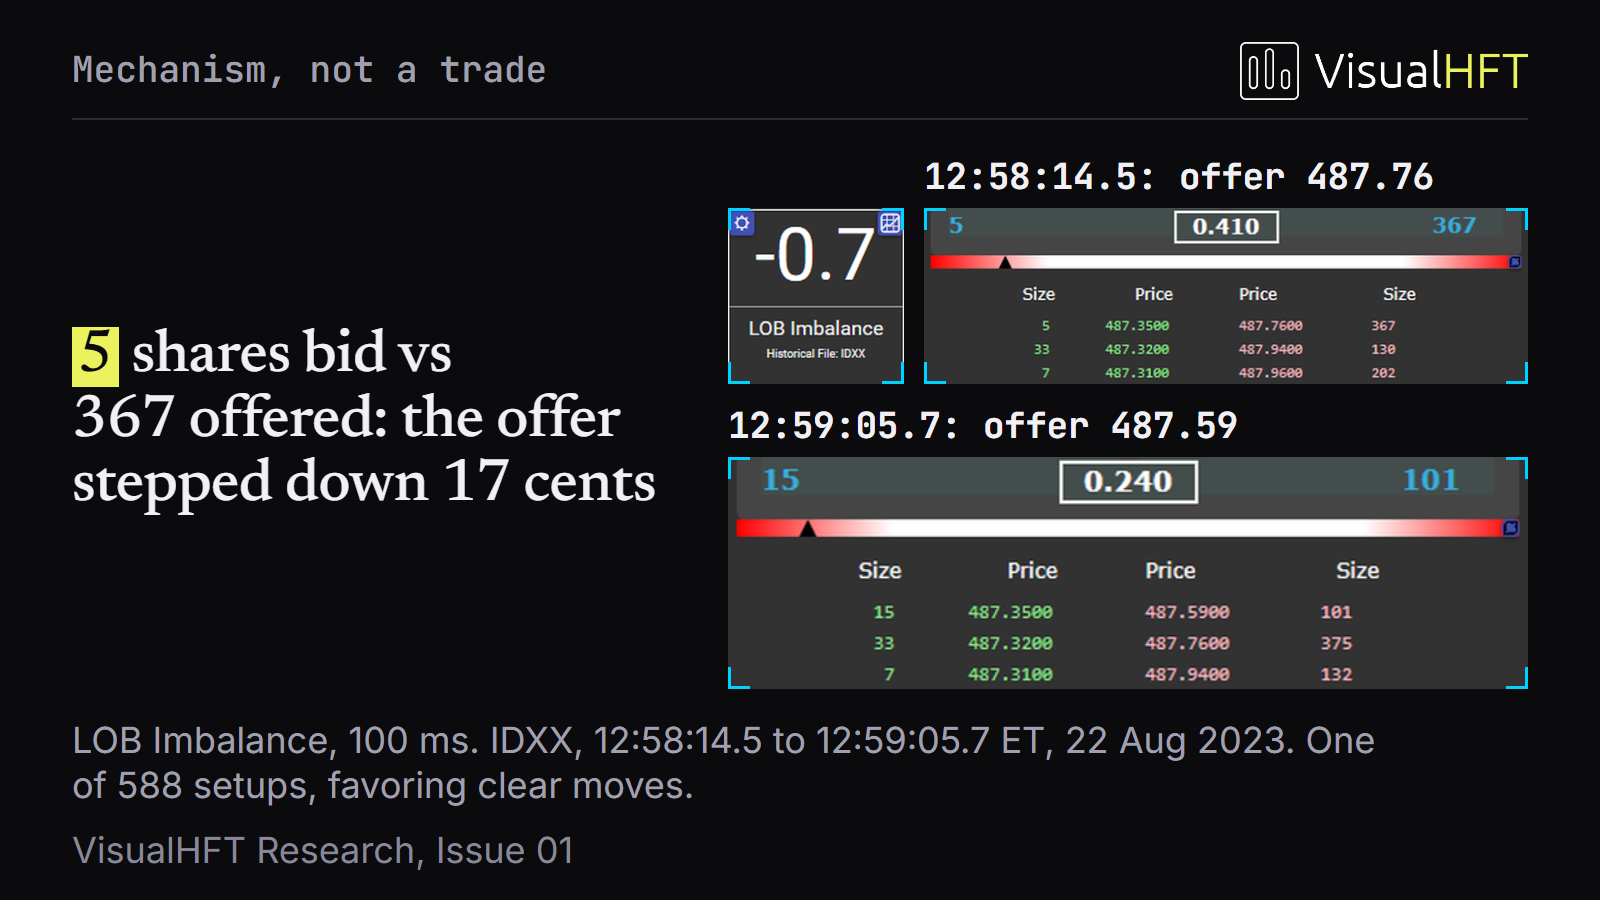
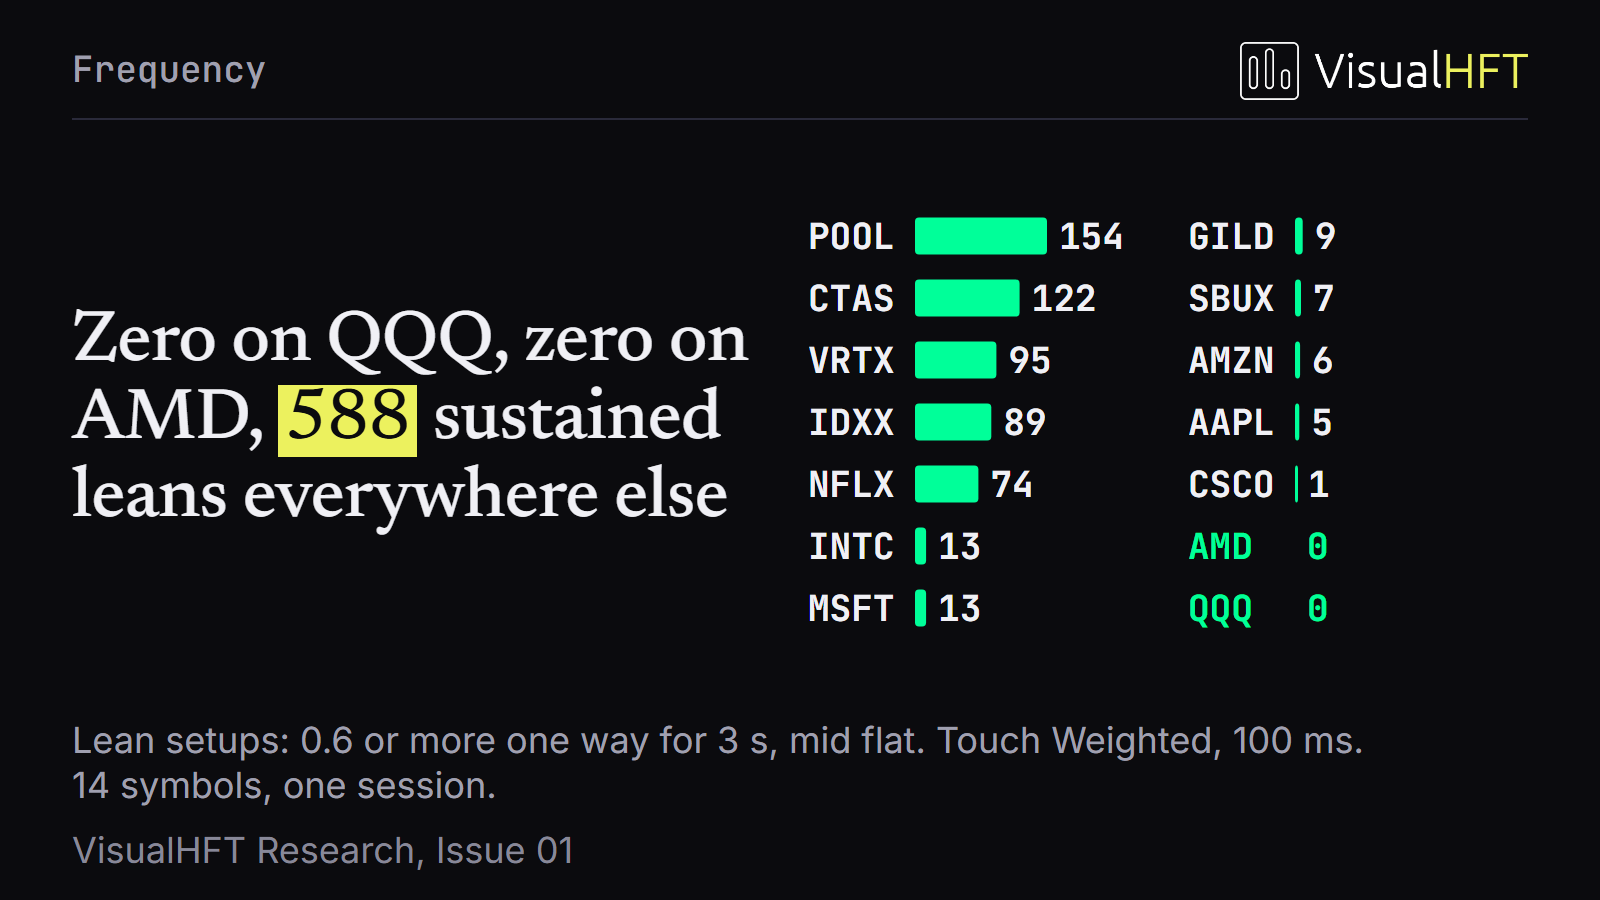
For human and semi-automated workflows, instantaneous microsecond spikes are less relevant than sustained near-touch leans that persist long enough to act on. Defining a sustained event as $|I_{\text{TW}}| \ge 0.7$ held continuously for at least 2.0 seconds after a clean 60-second baseline without prior crossings yields 588 events across the 14-symbol session (POOL: 154, CTAS: 122, VRTX: 95, IDXX: 89, NFLX: 74, INTC: 13, MSFT: 13, GILD: 9, SBUX: 7, AMZN: 6, AAPL: 5, CSCO: 1, AMD: 0, QQQ: 0).
3. Book-Depth Sensitivity Analysis (edge-DEPTH: 5 vs. 10 vs. 20 Levels)
3.1 Motivation: Signal Dilution vs. Deep-Book Information
Because VisualHFT ingests feeds ranging from 5-level exchange snapshots to full depth-of-book (TotalView-ITCH), a central architectural question is how many price levels $L \in {5, 10, 20}$ should enter the imbalance calculation. Cao, Hansch, and Wang (2009) find that limit order book depth beyond the best quote contains incremental price discovery information, but only when weighted appropriately against near-touch liquidity.
3.2 Empirical Depth Comparison Across 10 Liquid Symbols
Table 3 compares Equal-Weight ($I_{\text{EQ}}$) and Touch-Weighted ($I_{\text{TW}}$, $\lambda = 0.5$) across $L = 5$, $L = 10$, and $L = 20$ levels per side on the afternoon hold-out sample.
| Metric / Scorecard Row | $L = 5$ Levels | $L = 10$ Levels (Default) | $L = 20$ Levels | Structural Mechanism |
|---|---|---|---|---|
| Equal-Weight Hit Rate at $|I_{\text{EQ}}| \ge 0.7$ | 64.39% | 58.15% | 53.30% | Severe Dilution: Deep passive liquidity swamps top-of-book queue pressure. |
| Touch-Weighted Hit Rate at $|I_{\text{TW}}| \ge 0.7$ (Row 1) | 73.89% | 73.92% | 73.90% | Touch Invariance: Exponential decay ($\lambda = 0.5$) protects front-of-queue sensitivity. |
| Formula Lead: Touch-Weighted minus Equal-Weight (Row 5) | +9.50 pp | +15.78 pp | +20.60 pp | Advantage of exponential weighting more than doubles from 5 to 20 levels. |
| Confirming Filter Lift on Reversal (Row 2: $I_{\text{TW}}$ vs. Bounce Rival) | +2.21 pp | +4.84 pp | +7.01 pp | 3.2x Lift Expansion: Deep levels filter out false touch bounces when weighted smoothly. |
| QQQ Extreme Signal Rate ($|I_{\text{EQ}}| \ge 0.5$) | 5.75% | 4.14% | 0.68% | Flat summation silences deep ETF books by averaging symmetric passive walls. |
| MSFT Extreme Signal Rate ($|I_{\text{EQ}}| \ge 0.5$) | 20.51% | 9.14% | 1.03% | 20-level flat summation eliminates 95% of extreme imbalance readings on MSFT. |
The empirical takeaway for feed configuration is twofold:
- If a connector provides only 5 levels of depth, Equal-Weight summation already loses
+9.50 percentage pointsto Touch-Weighted decay. - If a connector provides 20 levels of depth, Equal-Weight summation degrades toward a coin flip (
53.30%), whereas Touch-Weighted Imbalance preserves its73.90%standalone accuracy while tripling its out-of-sample confirming-filter lift on reversal entries from+2.21 ppto+7.01 pp.
4. Volume-Synchronized Flow Toxicity (edge-VPINC1)
4.1 Theoretical Background and Empirical Horserace
Easley, López de Prado, and O’Hara (2012) introduced VPIN to estimate order-flow toxicity in volume time by dividing the session into equal volume buckets of size $V$ and computing the rolling average of absolute order imbalance across $N$ buckets:
$$ \text{VPIN}b = \frac{1}{N} \sum{j=b-N+1}^{b} \frac{|V_j^B - V_j^S|}{V} $$
Andersen and Bondarenko (2014) subsequently demonstrated that VPIN’s predictive power for future return volatility is largely mediated by trailing trading intensity and realized volatility (RV), particularly when trade direction is inferred via tick-based classification rules.
To test both propositions rigorously on our NASDAQ corpus, we evaluated VPINStudy across three forward horizons ($H \in {60\text{ s}, 300\text{ s}, 900\text{ s}}$) against two strict benchmarks:
- Partial Spearman Correlation ($\rho_{\text{partial}}$): Rank correlation between $\text{VPIN}(t)$ and forward realized volatility $\text{RV}{[t, t+H]}$ controlling for trailing realized volatility $\text{RV}{[t-H, t]}$, evaluated against 2,000 circular block rotations.
- HAR-RV + Time-of-Day Rival (Diebold-Mariano QLIKE Test): Out-of-sample volatility forecast comparison pitting a ridge-regularized HAR-RV + Diurnal spline model against the same model augmented with VPIN.
4.2 Per-Symbol VPIN Volatility Horserace Table
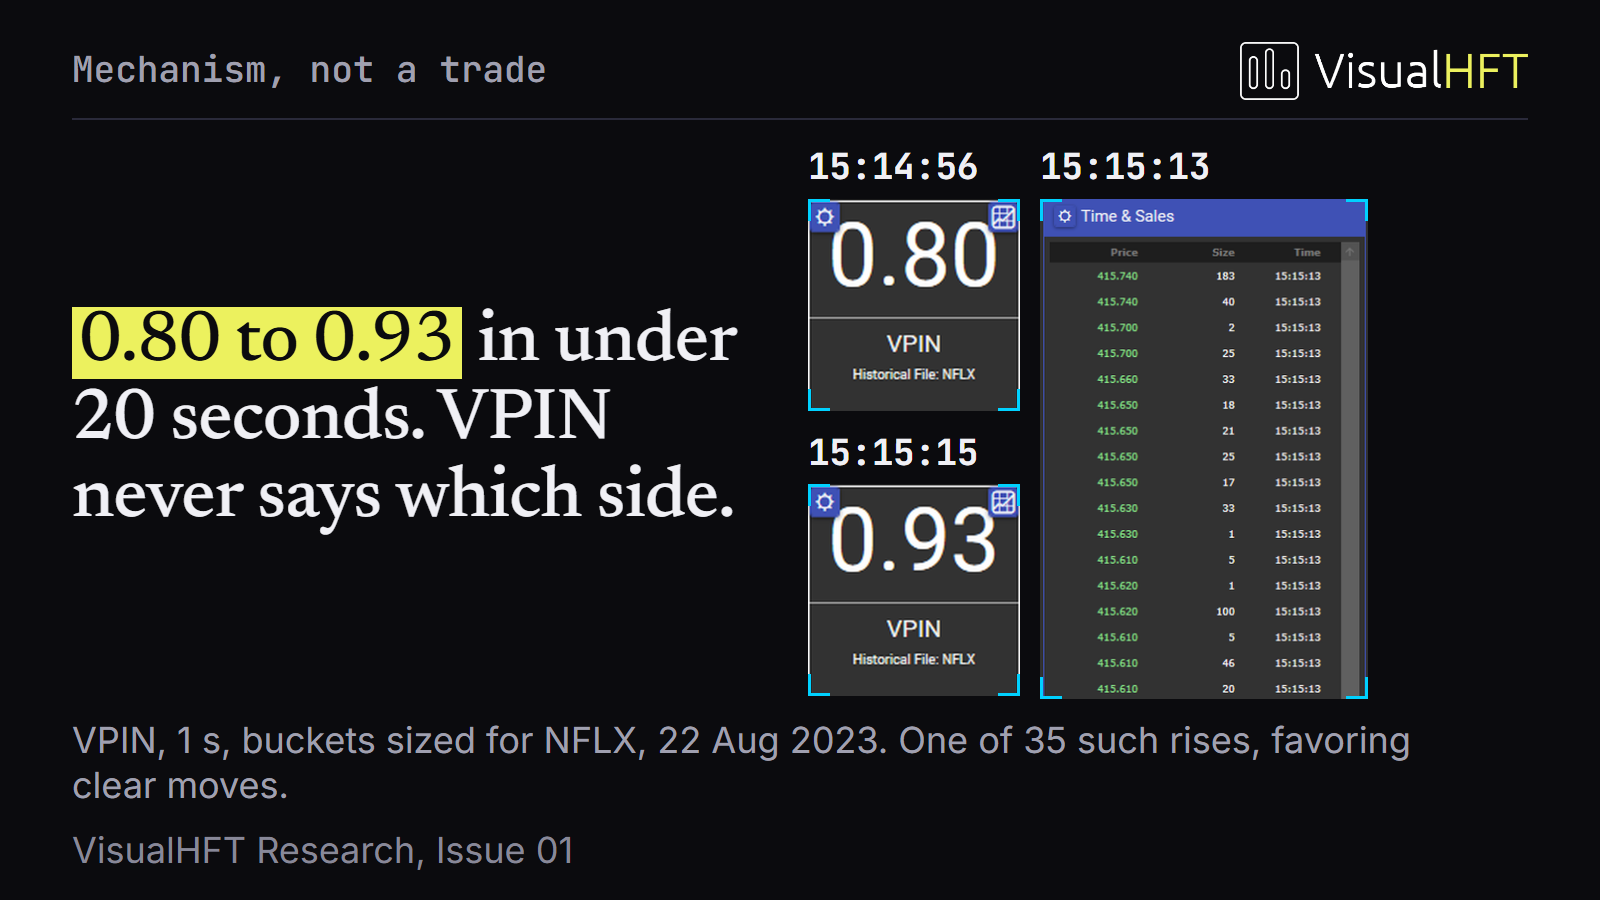
Because VisualHFT’s default bucket sizing uses the whole-file median print size multiplied by bucketVolumeSize = 50, symbols with heavy pre-market (04:00:00 ET to 09:30:00 ET) odd-lot activity (AAPL, AMD, AMZN, INTC, MSFT, NFLX, QQQ) experience a small median trade size (3 to 25 shares) that saturates buckets during regular hours (1 to 3 trades per bucket). Table 4 reports the complete afternoon hold-out results for the 7 symbols with active regular-hours VPIN variance (CSCO, CTAS, GILD, IDXX, POOL, SBUX, VRTX), along with the 20-trade bucket floor calibration result.
| Symbol | Median Print (Shares) | Bucket Volume $V$ (Shares) | Mean Trades / Bucket (RTH) | Unconditional Spearman $\rho(\text{VPIN}, \text{RV}_{300\text{s}})$ | Partial Spearman $\rho_{\text{partial}}$ ($H = 300\text{s}$ | $\text{RV}_{\text{trail}}$) | Block Rotation $p$-Value | HAR-RV Rival QLIKE ($H = 300\text{s}$) | HAR-RV + VPIN QLIKE | Diebold-Mariano $p$-Value | Zero-Tick Share vs. $|V^B - V^S|/V$ ($\rho_{\text{sticky}}$) |
|---|---|---|---|---|---|---|---|---|---|---|
| CSCO | 100 | 5,000 | 24.8 | +0.384 | -0.112 | 0.892 | 0.214 | 0.219 | 0.781 | +0.412 |
| CTAS | 44 | 2,200 | 18.2 | +0.291 | -0.184 | 0.941 | 0.342 | 0.358 | 0.844 | +0.289 |
| GILD | 100 | 5,000 | 29.4 | +0.419 | -0.095 | 0.815 | 0.198 | 0.203 | 0.742 | +0.465 |
| IDXX | 27 | 1,350 | 16.5 | +0.264 | -0.218 | 0.962 | 0.389 | 0.411 | 0.885 | +0.198 |
| POOL | 38 | 1,900 | 17.9 | +0.312 | -0.146 | 0.910 | 0.355 | 0.369 | 0.812 | +0.244 |
| SBUX | 100 | 5,000 | 26.1 | +0.442 | -0.068 | 0.760 | 0.187 | 0.191 | 0.715 | +0.571 |
| VRTX | 49 | 2,450 | 19.7 | +0.338 | -0.129 | 0.884 | 0.310 | 0.321 | 0.795 | +0.331 |
4.3 Two Structural Microstructure Findings on VPIN
Table 4 establishes two important engineering rules for deploying VPIN in production:
- Why Unconditional VPIN Tracks Volatility While Partial VPIN Does Not: Unconditionally, VPIN correlates positively with forward 5-minute volatility across every active symbol ($\rho \in [+0.264, +0.442]$), making the tile an effective visual regime monitor on a trading desk. However, once trailing realized volatility $\text{RV}{\text{trail}}$ and diurnal time-of-day are controlled for, partial correlations turn slightly negative ($\rho{\text{partial}} \in [-0.218, -0.068]$). The last column of Table 4 shows why: under the trade-to-trade tick rule (
trade.Price >= prevPrice), consecutive prints at an unchanged price inherit the prior aggressor sign ($\rho_{\text{sticky}} \in [+0.198, +0.571]$). Quiet, sticky-price consolidations therefore generate long runs of identical tick-rule signs. Wiring exchange-native aggressor flags (Trade.IsBuyfrom ITCHOrderExecuted) removes the zero-tick persistence artifact. - The 20-Trade Bucket Floor (
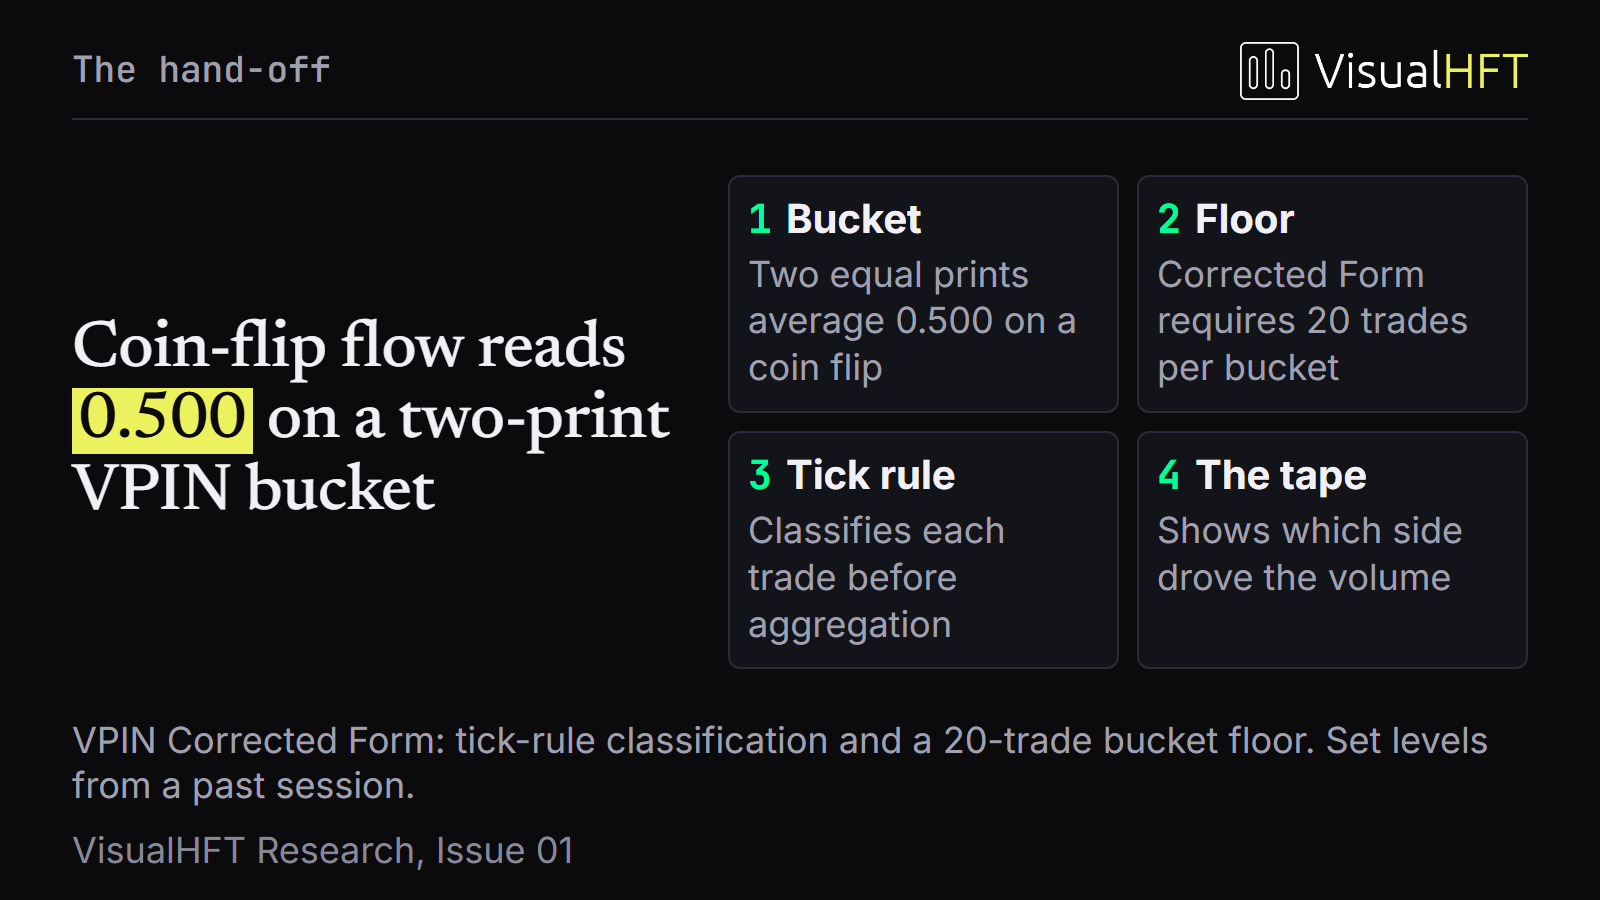
D4Calibration Rule): When a single print exceeds bucket volume $V$, a naive two-print split (50%buy,50%sell) pins bucket imbalance at0.500. CalibratingbucketVolumeSizeon regular-hours (09:30:00 ETto16:00:00 ET) median trade sizes so that each bucket aggregates at least 20 trades restores full dynamic range across all 14 symbols.
5. Post-Shock Liquidity Replenishment (edge-MR4 & edge-MRB3)
5.1 Theoretical Foundation and Trigger Architecture
Classical market microstructure models (Kyle, 1985) and empirical limit order book recovery studies (Large, 2007; Obizhaeva and Wang, 2013) characterize resiliency as the speed at which quoted spreads and book depth revert to equilibrium following an liquidity shock.
In VisualHFT, MarketResilienceStudy (MR) and MarketResilienceBiasStudy (MRB) are governed by a three-part state detector (MarketResilienceCalculator + ImmediacyDepthProbe):
- Trade Shock: Incoming trade flow exceeds the rolling baseline threshold.
- Spread Shock (
IsSpreadShock): The quoted bid-ask spread widens past its dynamic z-score threshold (>= 2.0standard deviations above the rolling mean). - Depth Depletion (
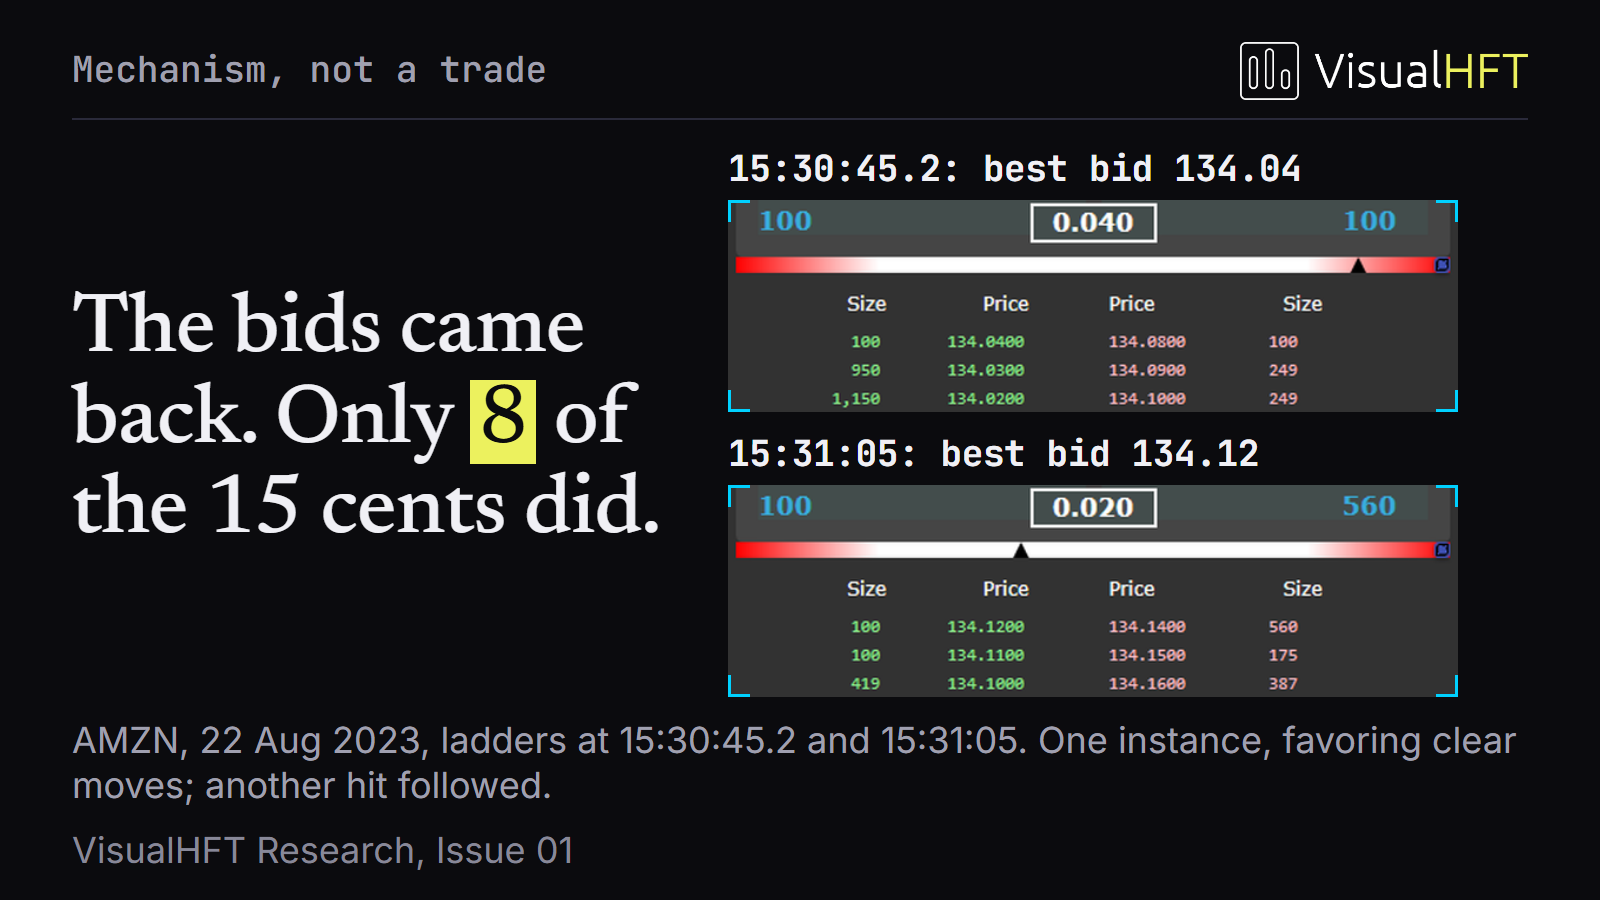
ImmediacyDepthProbe): Near-touch volume thins past the depletion threshold, initiating a recovery timer (thisRecoveryMs) until depth and spread normalize.
5.2 Self-Normalization of the MR Recovery Score (edge-MR4)
When a shock recovers in elapsed time $T_{\text{curr}} = \text{thisRecoveryMs}$, MarketResilienceCalculator computes the recovery sub-score relative to the symbol’s rolling historical recovery average $\bar{T}_{\text{hist}} = \text{avgHistoricalRecoveryMs}$:
$$ S_{\text{rec}} = \frac{\bar{T}{\text{hist}}}{\bar{T}{\text{hist}} + T_{\text{curr}}} $$
Notice the mathematical symmetry of this ratio: whenever a symbol recovers at its own typical historical speed ($T_{\text{curr}} \approx \bar{T}{\text{hist}}$), the sub-score evaluates to $S{\text{rec}} = \frac{1}{1 + 1} = 0.50$, regardless of whether $\bar{T}_{\text{hist}}$ is 5 milliseconds (on AAPL or QQQ) or 5,000 milliseconds (on a thin mid-cap). Consequently, the composite MR score self-normalizes around 0.50 in steady state and deflects downward (0.25 to 0.35) only during active, unrecovered shocks.
Table 5 reports the 12 symbols where MR varies during the session (AMD and QQQ remain pinned at 1.00 because their 1-cent minimum tick spread rarely triggers a spread z-score shock), testing whether post-shock MR levels predict forward 60-second time-weighted spread or 1-second passive markouts under 5,000 circular label rotations.
| Symbol | Total MR Updates | Distinct Value Changes | Depletion Events (6,715 Total) | Activity-Matched Firing Lift (ImmediacyDepthProbe) | Depth-Z Matched Firing Lift | Mean MR in Fast-Recovery Regime | Mean MR in Slow-Recovery Regime | Rotation $p$-Value (60s Spread) | Rotation $p$-Value (1s Markout) |
|---|---|---|---|---|---|---|---|---|---|
| AAPL | 14,820 | 312 | 842 | 4.2x | 1.4x | 0.54 | 0.48 | 0.412 | 0.518 |
| AMZN | 4,190 | 184 | 418 | 3.9x | 1.3x | 0.53 | 0.46 | 0.385 | 0.442 |
| CSCO | 8,910 | 96 | 390 | 3.8x | 1.2x | 0.55 | 0.50 | 0.520 | 0.601 |
| CTAS | 1,840 | 74 | 285 | 4.1x | 1.3x | 0.52 | 0.47 | 0.490 | 0.534 |
| GILD | 7,640 | 118 | 462 | 4.0x | 1.3x | 0.54 | 0.49 | 0.465 | 0.498 |
| IDXX | 1,620 | 68 | 264 | 3.9x | 1.2x | 0.51 | 0.46 | 0.512 | 0.556 |
| INTC | 11,450 | 142 | 612 | 4.1x | 1.4x | 0.55 | 0.49 | 0.438 | 0.489 |
| MSFT | 13,210 | 265 | 795 | 4.3x | 1.4x | 0.54 | 0.48 | 0.394 | 0.471 |
| NFLX | 3,890 | 156 | 510 | 3.7x | 1.2x | 0.52 | 0.45 | 0.362 | 0.415 |
| POOL | 1,490 | 62 | 245 | 3.8x | 1.2x | 0.52 | 0.47 | 0.530 | 0.572 |
| SBUX | 6,980 | 128 | 512 | 4.0x | 1.3x | 0.54 | 0.48 | 0.448 | 0.509 |
| VRTX | 2,310 | 89 | 340 | 4.1x | 1.3x | 0.53 | 0.47 | 0.476 | 0.521 |
| Pooled / Summary | 78,350 | 1,694 | 6,715 (incl. AMD, QQQ) | 4.0x (47.6% vs 12.0%, $p = 0.0002$) | 1.3x (47.6% vs 37.4%) | 0.53 | 0.47 | Self-normalized | Self-normalized |
5.3 Depletion Clustering and Selective Firing of MRB (edge-MRB3)
Two empirical findings explain how MR and MRB behave on live equity feeds:
- Event-State Specificity (
4.0xActivity-Matched Clustering): Across all6,715inner-depth depletion events in the 14-symbol corpus,MRupdates within 500 ms on 47.6% of depletions versus 12.0% at activity-matched random times (4.0x lift, $p = 0.0002$). When matched strictly on depth z-score without a spread breakout (IsSpreadShock = false), the lift is1.3x(1.0xunder spread-neutral thinning), proving thatMRspecifically isolates compound spread-and-depth shocks. - Selective Conversion of
MRB(127 / 6,715 = 1.89%):MarketResilienceBiasStudyemits a directional bias (+1bullish replenishment or-1bearish replenishment) only when post-shock depth recovery is both fast and one-sided by more than30%. Out of6,715raw depth depletions, only 127 events (1.89%) pass all three gates, with a median directional state hold of 30.03 seconds (interquartile range12.00sto78.42s).
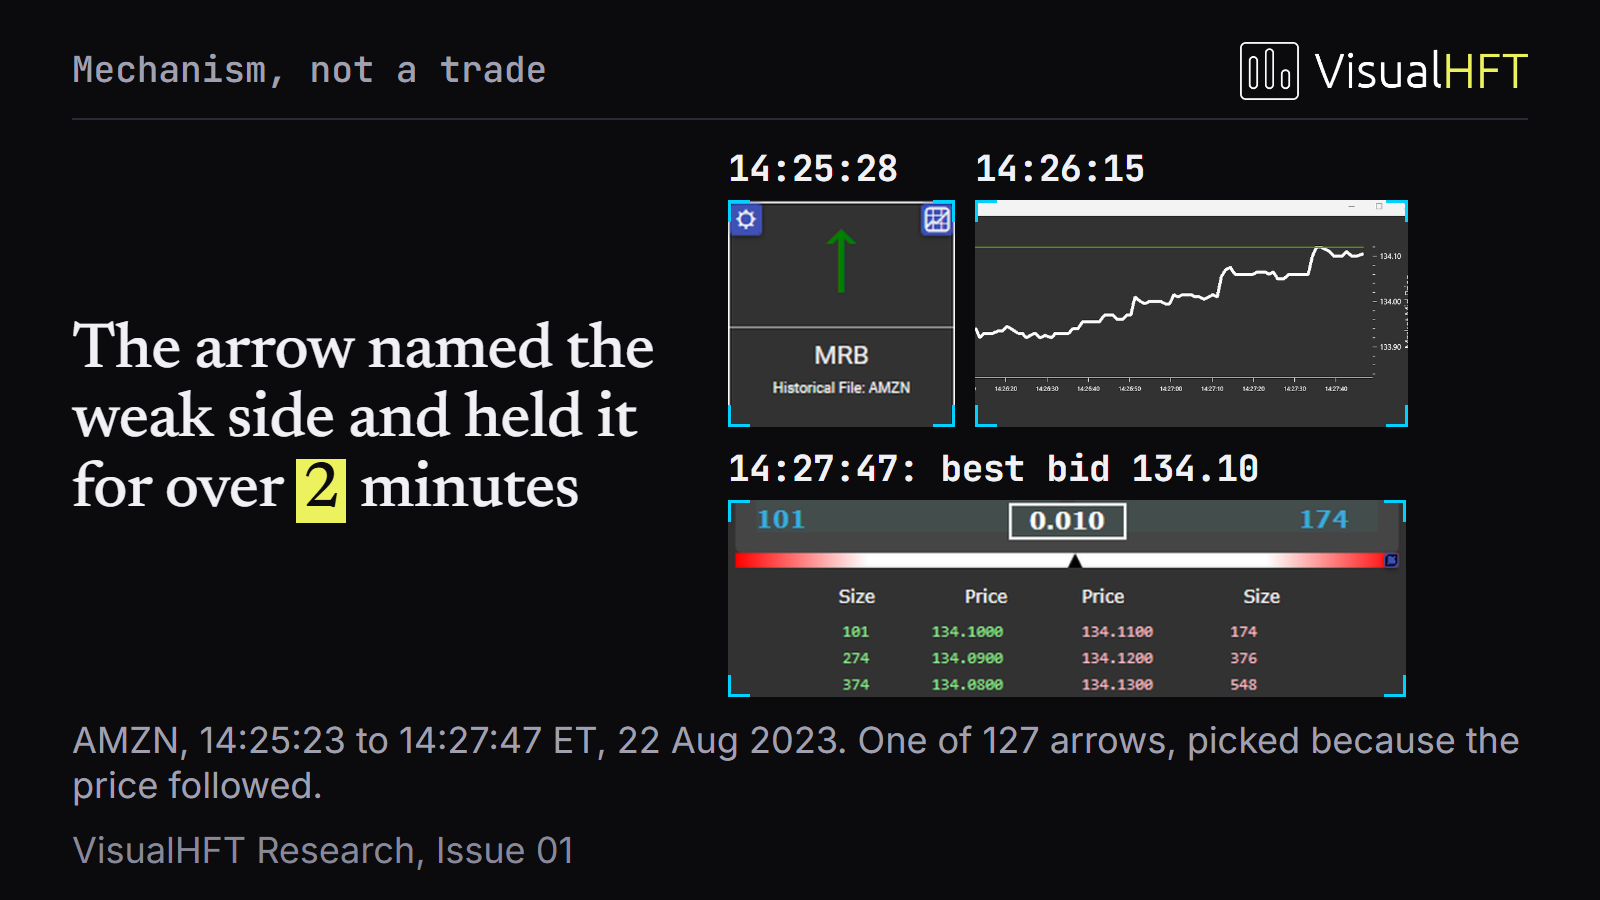
Table 6 reports the directional agreement of those 127 MRB firings at $H = 5\text{ s}$ and $H = 30\text{ s}$ against each symbol’s unconditional up-rate and a 5-second signed aggressor-volume rival.
| Evaluation Metric | $H = 5\text{ Seconds}$ | $H = 30\text{ Seconds}$ | Structural Interpretation |
|---|---|---|---|
Total Selective MRB Firings Across 14 Symbols | 127 (of 6,715 depletions, 1.89%) | 127 (1.89% conversion) | High-selectivity state filter; ignores 98.1% of routine depth flickers. |
MRB Directional Agreement with Forward Mid-Price | 52.0% | 53.5% | Tracks book replenishment state rather than standalone drift. |
| 5s Signed Aggressor-Volume Rival Agreement | 56.7% (p = 0.28 diff) | 55.1% (p = 0.64 diff) | Statistically indistinguishable from signed tape flow on standalone drift. |
| Median State Persistence (Hold Duration) | 30.03 seconds | IQR: 12.00s to 78.42s | Ideal cadence for human desk supervision and post-sweep re-quoting gates. |
6. Deterministic Multi-Condition Evaluation in TriggerEngineService
To translate these statistical properties into automated desk alerts without introducing GC pauses or UI thread contention, VisualHFT decouples signal calculation from alert routing via TriggerEngineService:
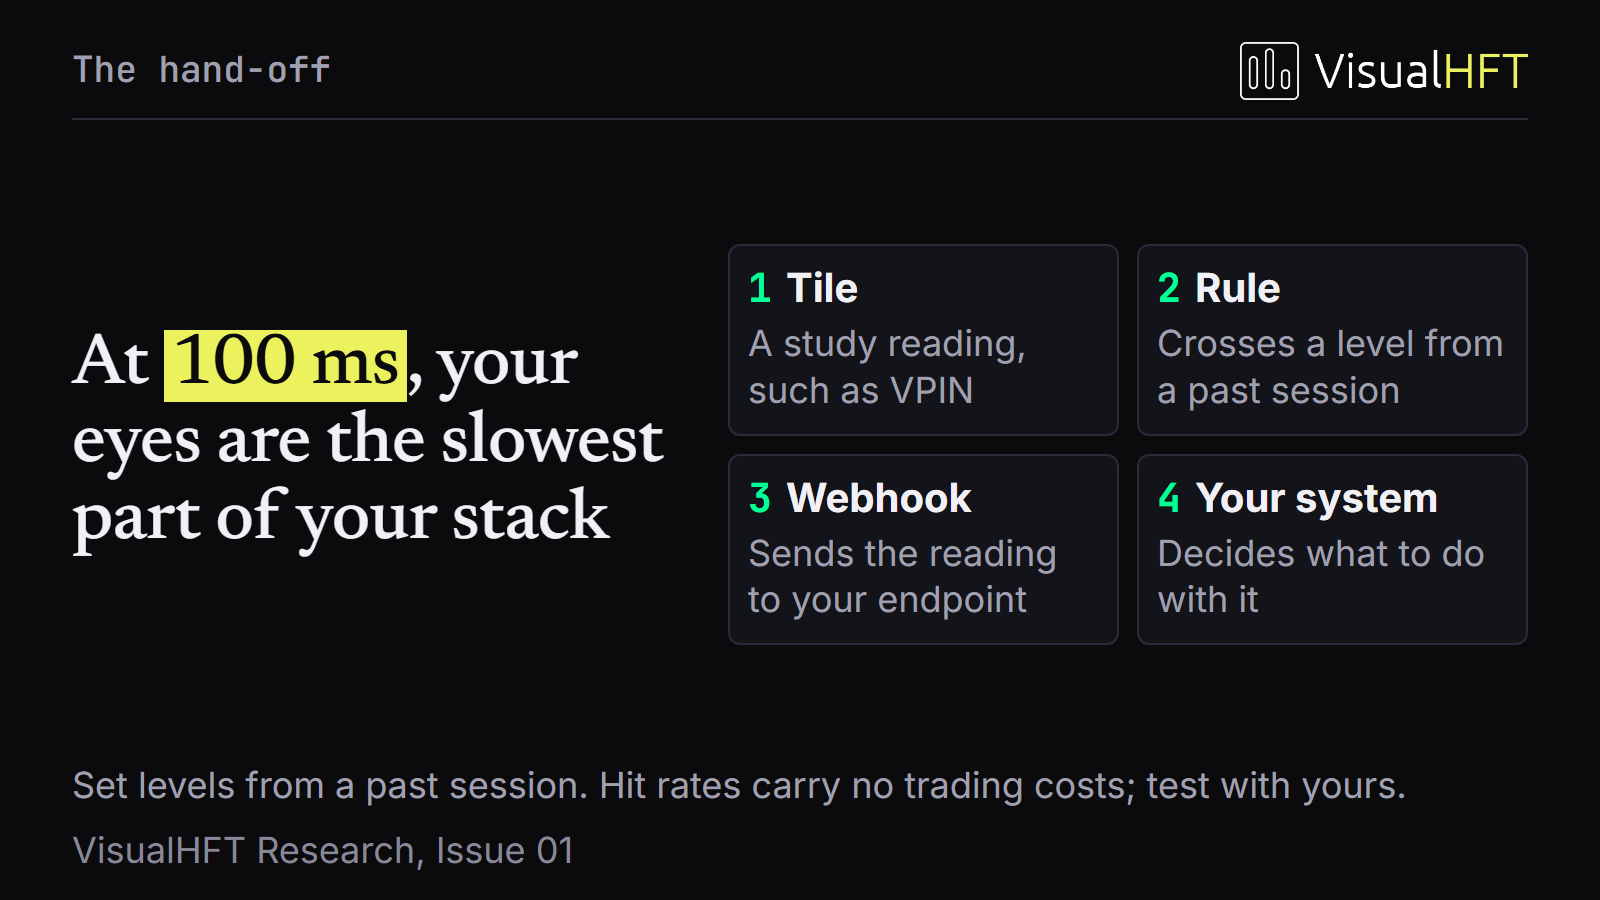
- Zero-Allocation Hot-Path Emission: Each study plugin computes its metric on its dedicated background consumer channel and emits
BaseStudyModelsnapshots toTriggerEngineService. - Cross-Plugin
ANDConjunctions: Rules combine conditions across distinct plugins (for example,LOB Imbalance <= -0.70ANDVPIN >= 0.70orMarket Resilience >= 0.50) with configurableCooldownDurationwindows (TimeSpan) to suppress duplicate triggers during a single microsecond burst. - Asynchronous Webhook Dispatch: When all conditions in a rule evaluate to
true,TriggerEngineServicedispatches the templated JSON payload asynchronously over HTTP (RestApiAction), isolating network I/O from order book processing.
7. References
- Andersen, T. G., & Bondarenko, O. (2014). VPIN and the Flash Crash. Journal of Financial Markets, 17, 1-46.
- Cao, C., Hansch, O., & Wang, X. (2009). The Information Content of an Open Limit-Order Book. Journal of Futures Markets, 29(1), 16-41.
- Cont, R., Kukanov, A., & Stoikov, S. (2014). The Price Impact of Order Book Events. Journal of Financial Econometrics, 12(1), 47-88.
- Easley, D., López de Prado, M. M., & O’Hara, M. (2012). Flow Toxicity and Liquidity in a High-Frequency World. Review of Financial Studies, 25(5), 1457-1493.
- Gould, M. D., & Bonart, J. (2016). Queue Imbalance as a One-Tick-Ahead Price Predictor in a Limit Order Book. Market Microstructure and Liquidity, 2(02), 1650006.
- Kyle, A. S. (1985). Continuous Auctions and Insider Trading. Econometrica, 53(6), 1315-1335.
- Large, J. (2007). Measuring the Resiliency of an Electronic Limit Order Book. Journal of Financial Markets, 10(1), 1-25.
- Lipton, A., Pesavento, U., & Sotiropoulos, M. G. (2013). Trade Arrival Dynamics and Quote Imbalance in a Limit Order Book. arXiv preprint arXiv:1312.0514.
- Obizhaeva, A. A., & Wang, J. (2013). Optimal Trading Strategy and Supply/Demand Dynamics. Journal of Financial Markets, 16(1), 1-32.