From Signal to Trade, Part 1: Turning Book Imbalance and Toxicity into Desk Rules
In our earlier diagnostic notes (Six Study Tiles, One NASDAQ Day and VisualHFT Research, Issue 01), we examined six microstructure plugins in isolation to answer a foundational question: what does each formula compute, and does it hold up on raw NASDAQ TotalView-ITCH data?
Knowing that a metric works on historical tape is only half the problem. Once a tile lights up on your screen, how do you turn that number into an execution decision without paying away your edge to the bid-ask spread?
This two-part series shifts from single-tile diagnostics to execution architecture:
- Part 1 (this guide) covers the entry, sizing, and replenishment workflow: how to use LOB Imbalance as a confirming filter rather than a spread-crossing trigger, how feed depth (5, 10, or 20 levels) changes your signal, how VPIN, Market Resilience (MR), and Market Resilience Bias (MRB) govern quote sizing and post-sweep re-entry, and how to automate the entire stack inside the VisualHFT Trigger Engine.
- Part 2 (next week) covers the stand-down circuit breakers: how Order-to-Trade Ratio (OTR) and Trade-to-Order Ratio (TTO) detect when displayed liquidity is hollow cancel-churn or an active sweep so your execution engine pulls resting orders in time.
For readers who want the full mathematical derivations, circular block-bootstrap confidence intervals, Diebold-Mariano volatility horse races, and per-symbol scorecards across all 14 symbols, read the companion research paper: Empirical Evaluation of LOB Imbalance, VPIN, and Market Resilience on NASDAQ TotalView-ITCH.
1. The Execution Trap: Why High Accuracy Alone Loses to the Spread
When traders first add an order book imbalance indicator to their workspace, the instinct is simple: if the offer side is stacked ten-to-one against the bid, sell immediately and cross the spread before the price drops.
On our NASDAQ TotalView-ITCH benchmark (33,435,762 full-depth messages across 14 symbols), Touch-Weighted LOB Imbalance predicts the direction of the next mid-price move 73.9% of the time when the reading reaches $|I_{\text{TW}}| \ge 0.7$, beating the unconditional base rate by +22.2 percentage points and outperforming flat equal-weight depth summation (58.2%) by +15.8 points.
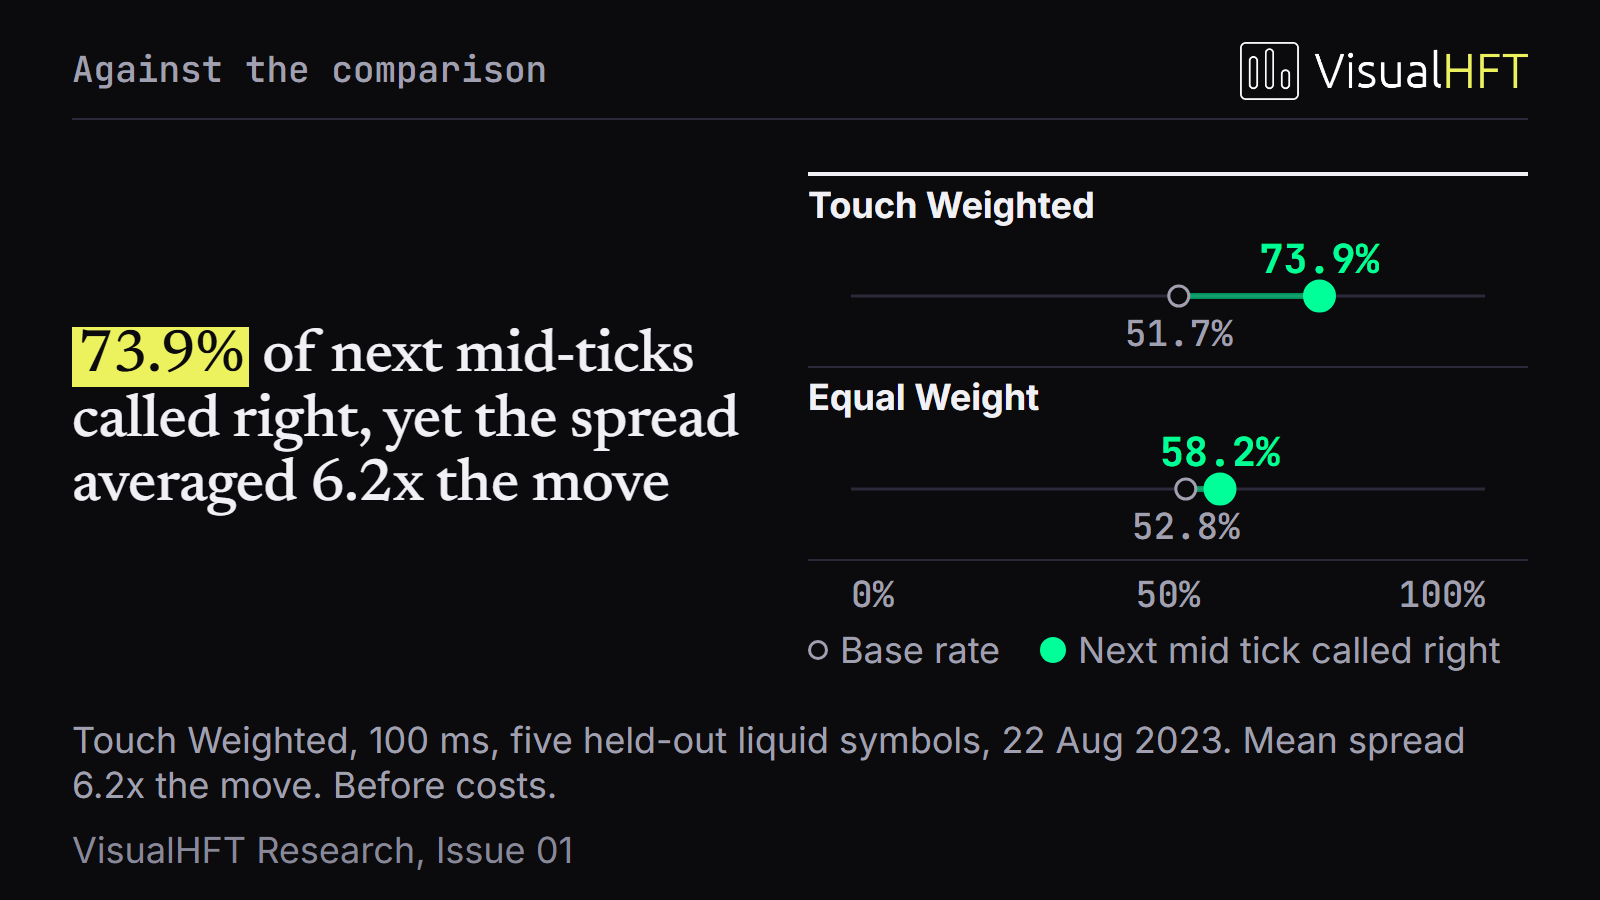
Why does Touch-Weighted Imbalance outperform flat summation by such a wide margin? A flat sum across the top 10 levels treats 500 shares parked nine ticks behind the market identically to 500 shares resting at the best bid or offer. By weighting each level $k$ by its distance from the touch ($w_k = \exp(-0.5 \cdot k)$), the VisualHFT tile isolates the front of the queue where fills actually occur. That structural advantage holds across every single liquid symbol on the tape:
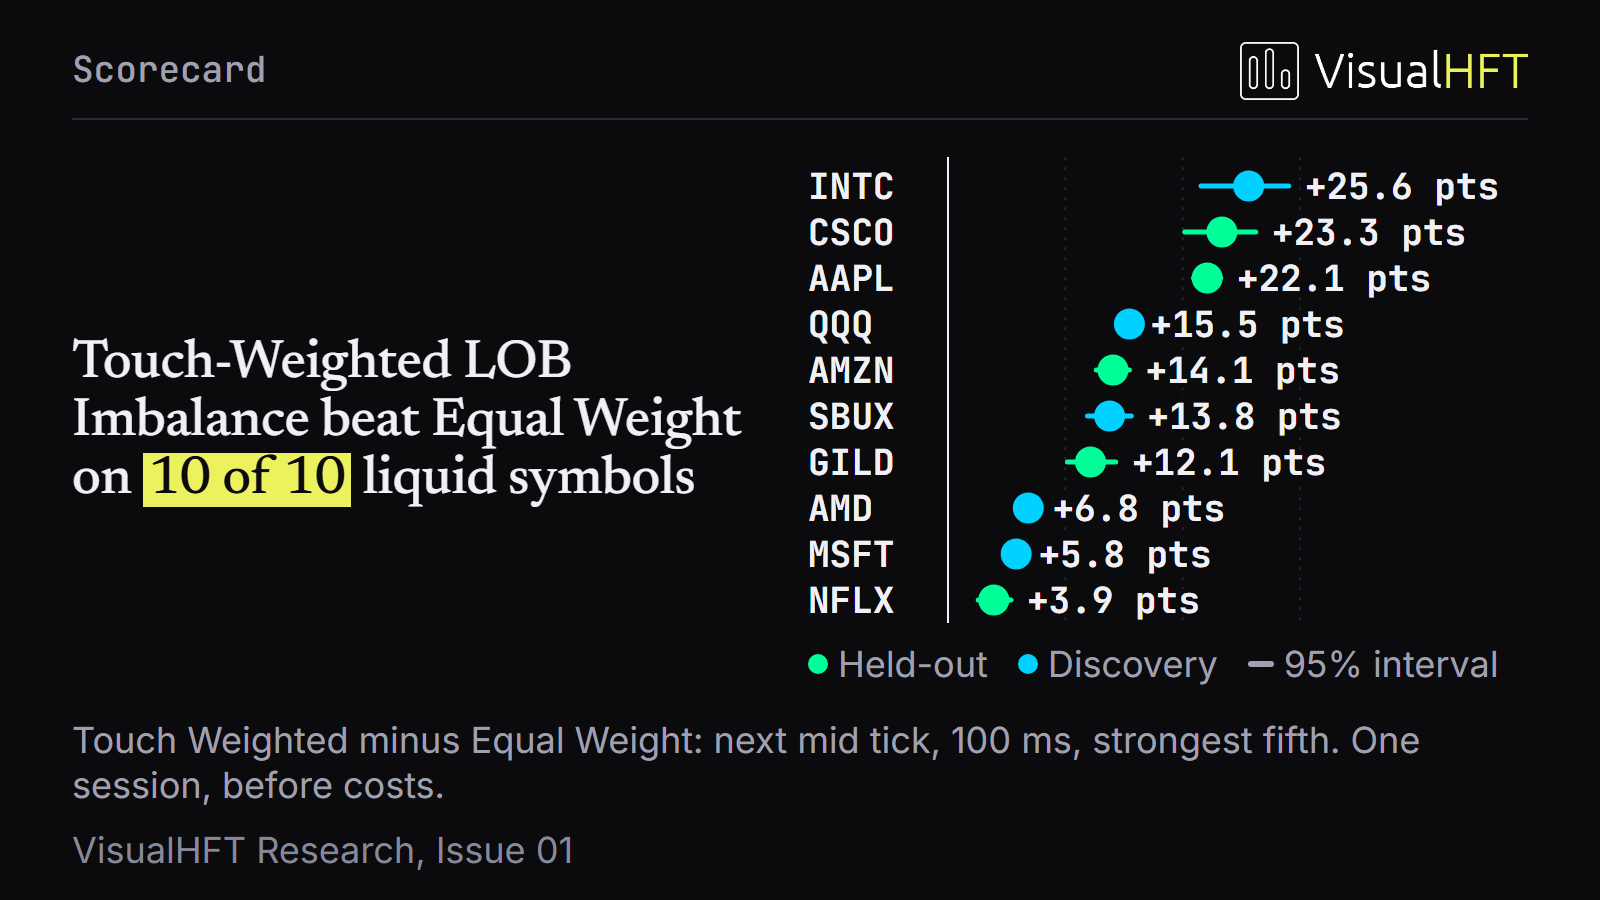
Here is the execution catch: even at a 73.9% hit rate, crossing the bid-ask spread on an imbalance reading alone is a losing trade. Across the 10 liquid symbols in our benchmark, the median quoted spread at the moment of an extreme imbalance reading is 6.2 times larger than the average mid-price move that follows (ranging from 2.3x on CSCO and 2.7x on AAPL up to 9.5x on wide-spread names like NFLX). If you pay the full spread to enter as a taker, the transaction cost swallows the directional edge.
2. How to Trade LOB Imbalance: The Confirming Filter Workflow
Instead of using LOB Imbalance to chase the market across the spread, systematic desks use it in three specific ways:
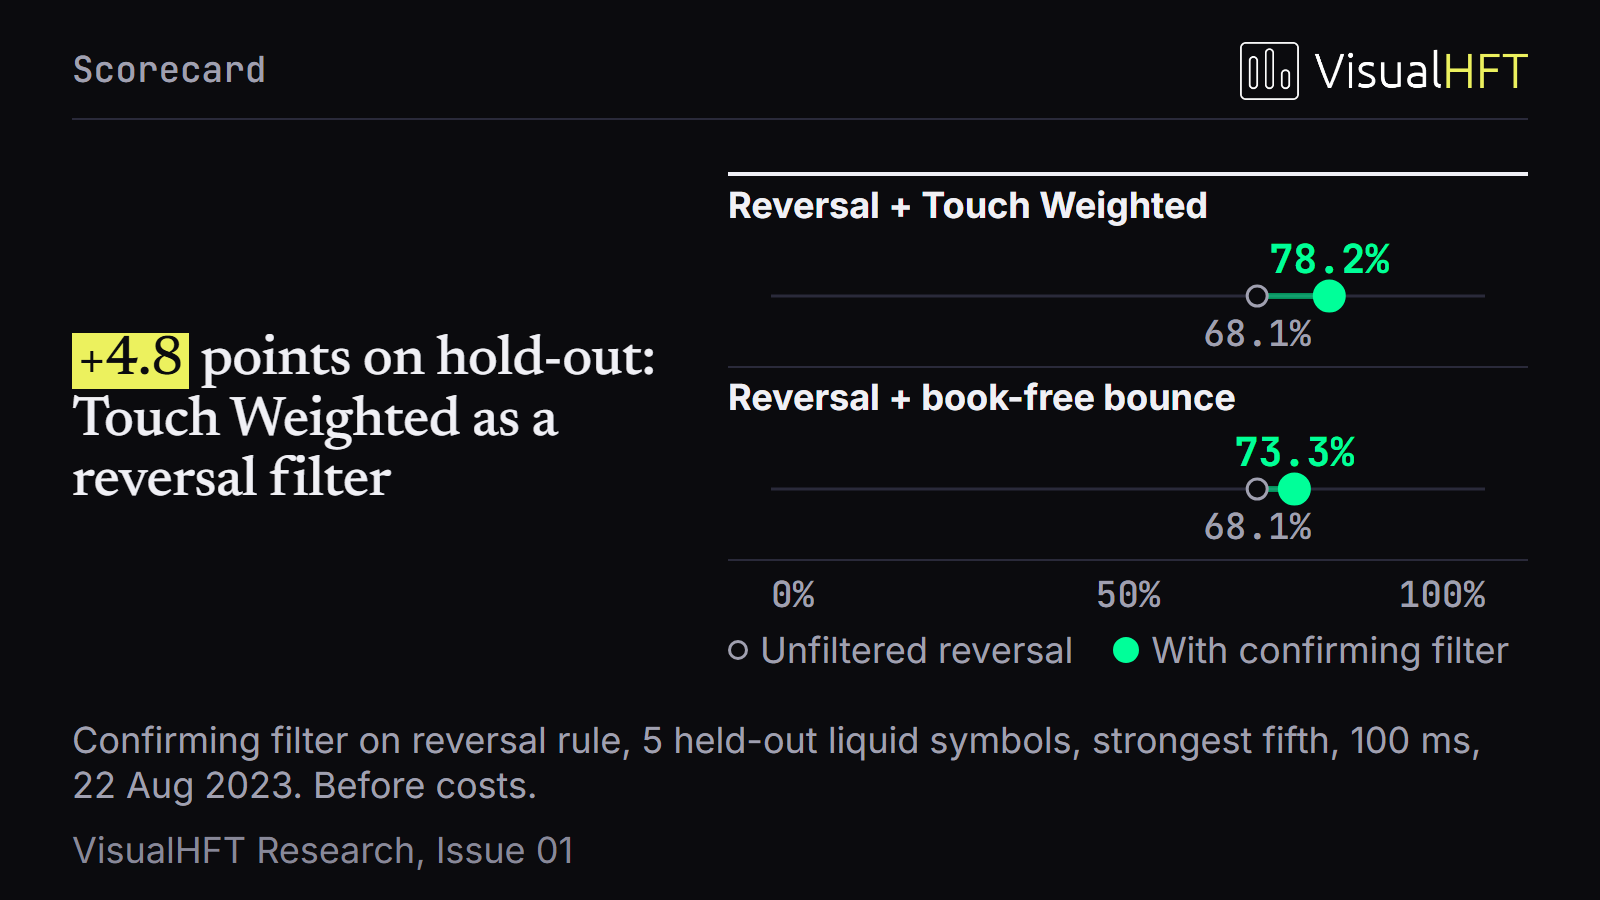
- As a confirming gate on reversal entries: Wait for a price dislocation first, then check whether the near-touch book confirms the move before leaning on the quote. When Touch-Weighted Imbalance confirms a last-move reversal on held-out NASDAQ data, directional accuracy rises from 68.1% (unfiltered reversal) and 73.3% (a book-free bounce filter) to 78.2%, delivering +4.8 percentage points of incremental accuracy.
- To skew passive resting quotes: When you are already working a limit order near the touch, an extreme opposing lean (
-0.7against your resting bid) tells you to step your bid back a tick or cancel before the level gives way. - To select the right feed depth for your strategy: Because VisualHFT normalizes any
IDataFeedconnector into the sameOrderBookpipeline, we tested how 5-level, 10-level, and 20-level feeds change the signal. On a flat equal-weight calculation, deeper books dilute the touch with passive background orders (QQQextreme readings drop from5.75%of updates at 5 levels to0.68%at 20 levels). With Touch-Weighted Imbalance, adding 20 levels of depth triples the confirming-filter lift from +2.2 points (at 5 levels) to +7.0 points (at 20 levels), because exponential decay preserves touch sensitivity while still seeing institutional walls resting 10 to 20 ticks out.
What a Confirmed Lean Looks Like on the Ladder

Watch how this plays out on IDXX at 12:58:14.5 ET. The best bid ($486.67) holds just 5 shares, while the top five offer levels carry 367 shares. Because the bulk of that supply sits right at the front of the ask queue, the Touch-Weighted LOB Imbalance tile drops to -0.7.
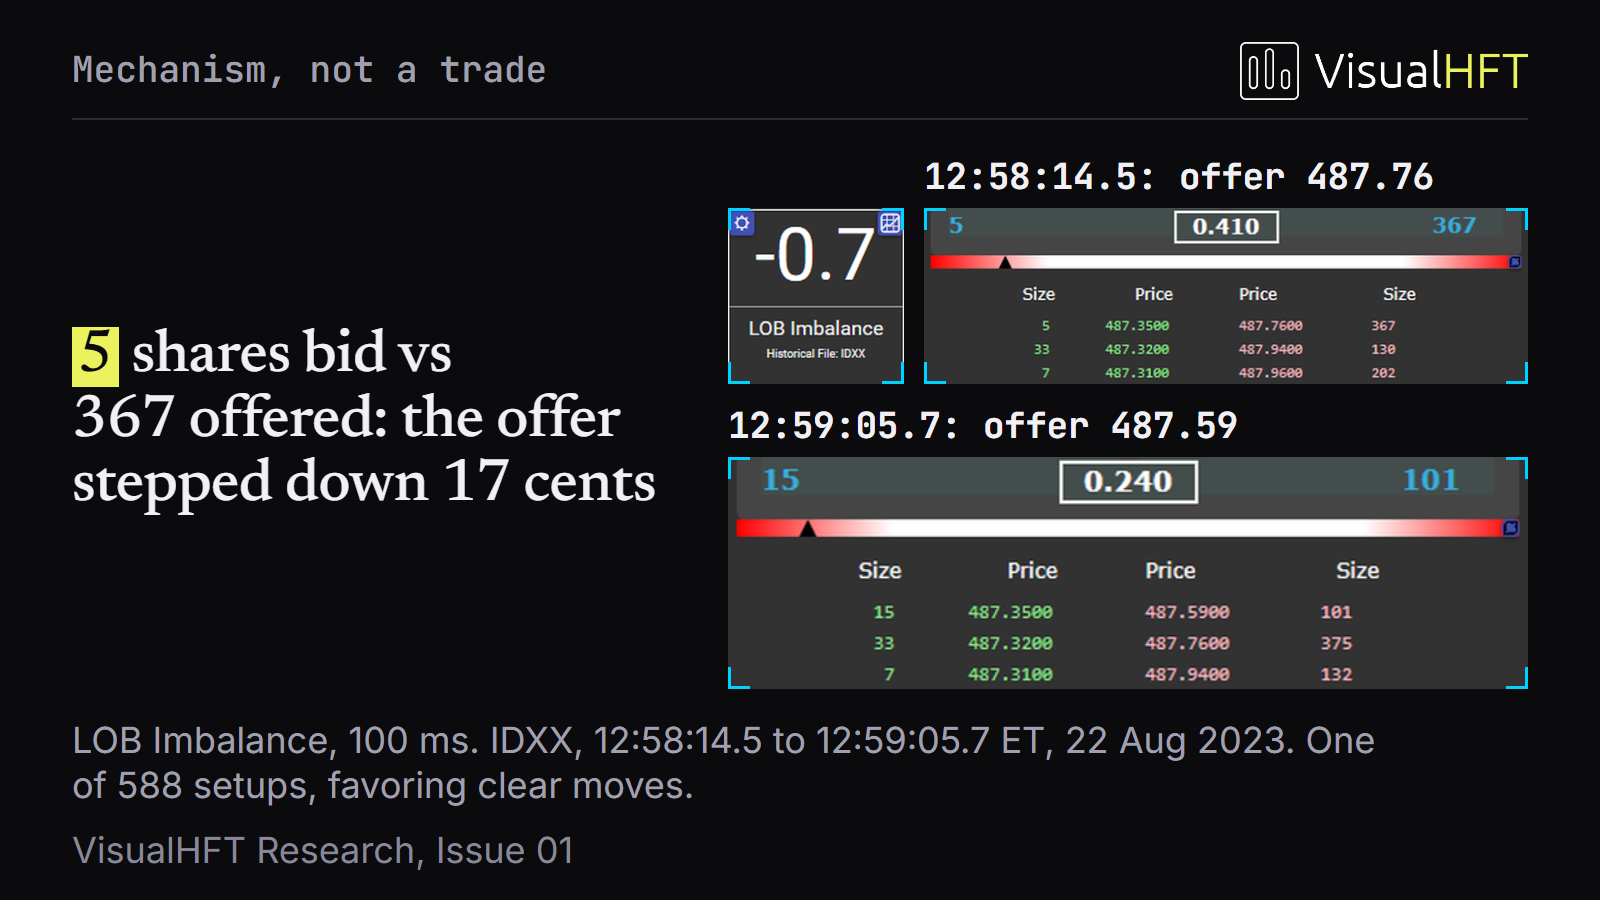
Fifty-one seconds later at 12:59:05.7 ET, sellers step the best offer down 17 cents to $487.59 x 101, pulling the mid-price from $487.215 down to $487.130. A desk using that -0.7 reading as a passive skew signal avoids getting filled at the old $486.67 bid and steps down with the market.
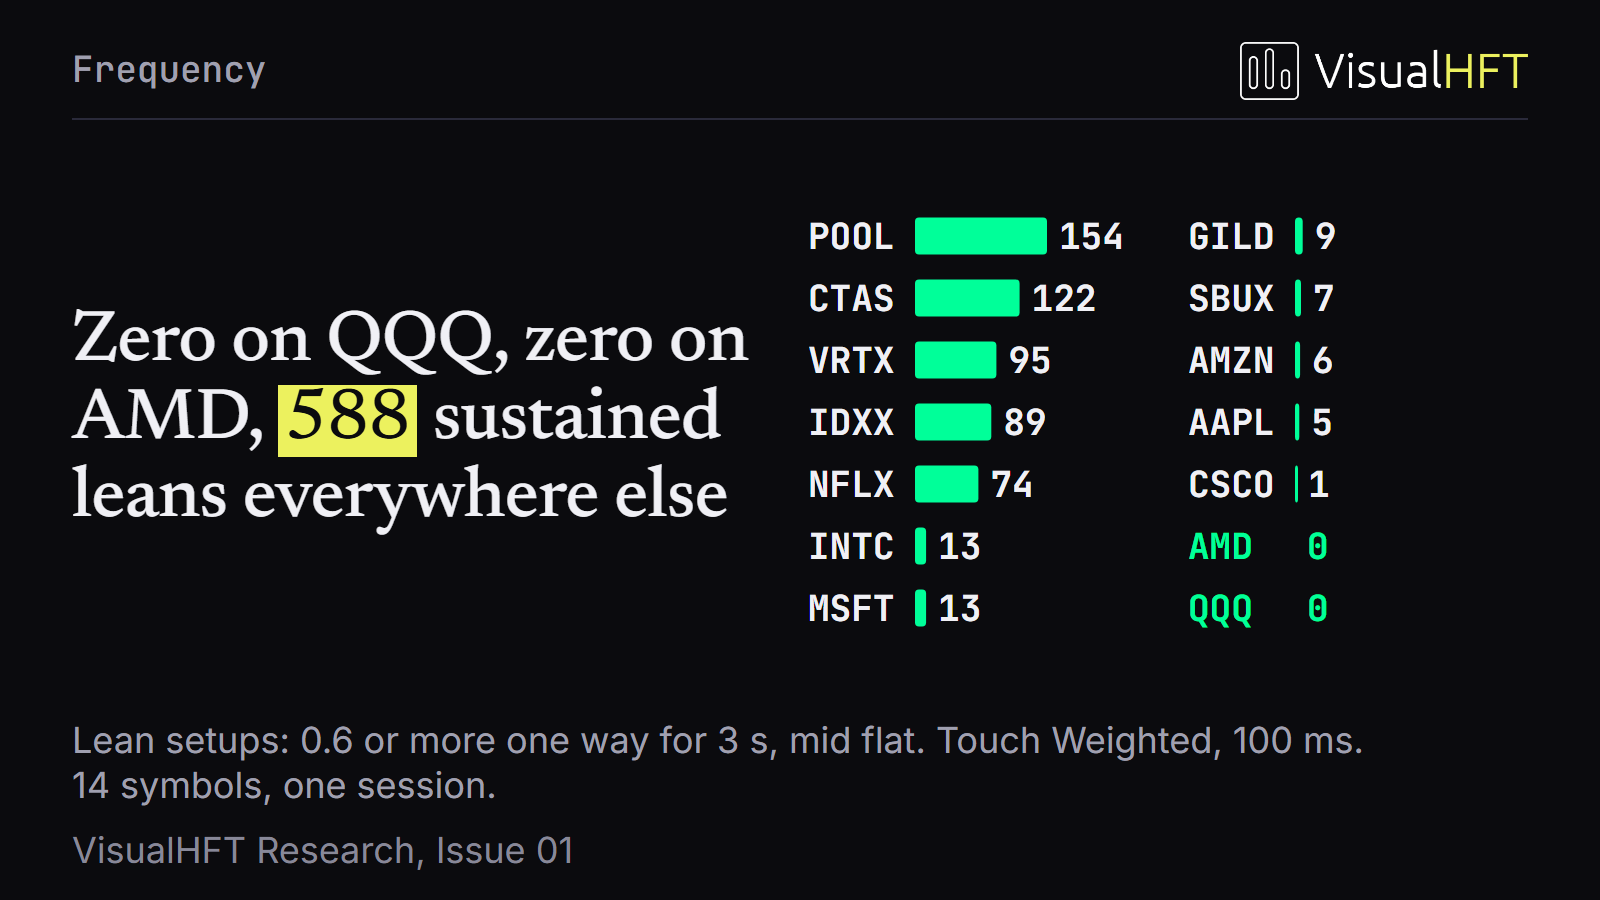
Across a single NASDAQ session, sustained near-touch leans that hold past |0.7| for at least two seconds with a clean one-minute prior baseline occur 588 times across our 14-symbol universe, concentrated in wider-spread book-thin names where passive queue placement matters most:
3. Sizing and Replenishment: VPIN, Market Resilience, and MRB
Book imbalance tells you how resting limit orders are stacked right now, but it does not tell you how aggressive the incoming trade tape is or whether the book is refilling after a hit. That is why the workspace pairs LOB Imbalance with three companion tiles.
VPIN: Flow Toxicity and Volatility Regime Monitor
While LOB Imbalance watches resting depth, VPIN (Volume-Synchronized Probability of Informed Trading) measures the one-sidedness of executed trades across fixed volume buckets.
During the NFLX afternoon session at 15:15:13 ET, a concentrated burst of buyer-initiated prints sweeps the tape and drives the VPIN tile from 0.80 to 0.93.
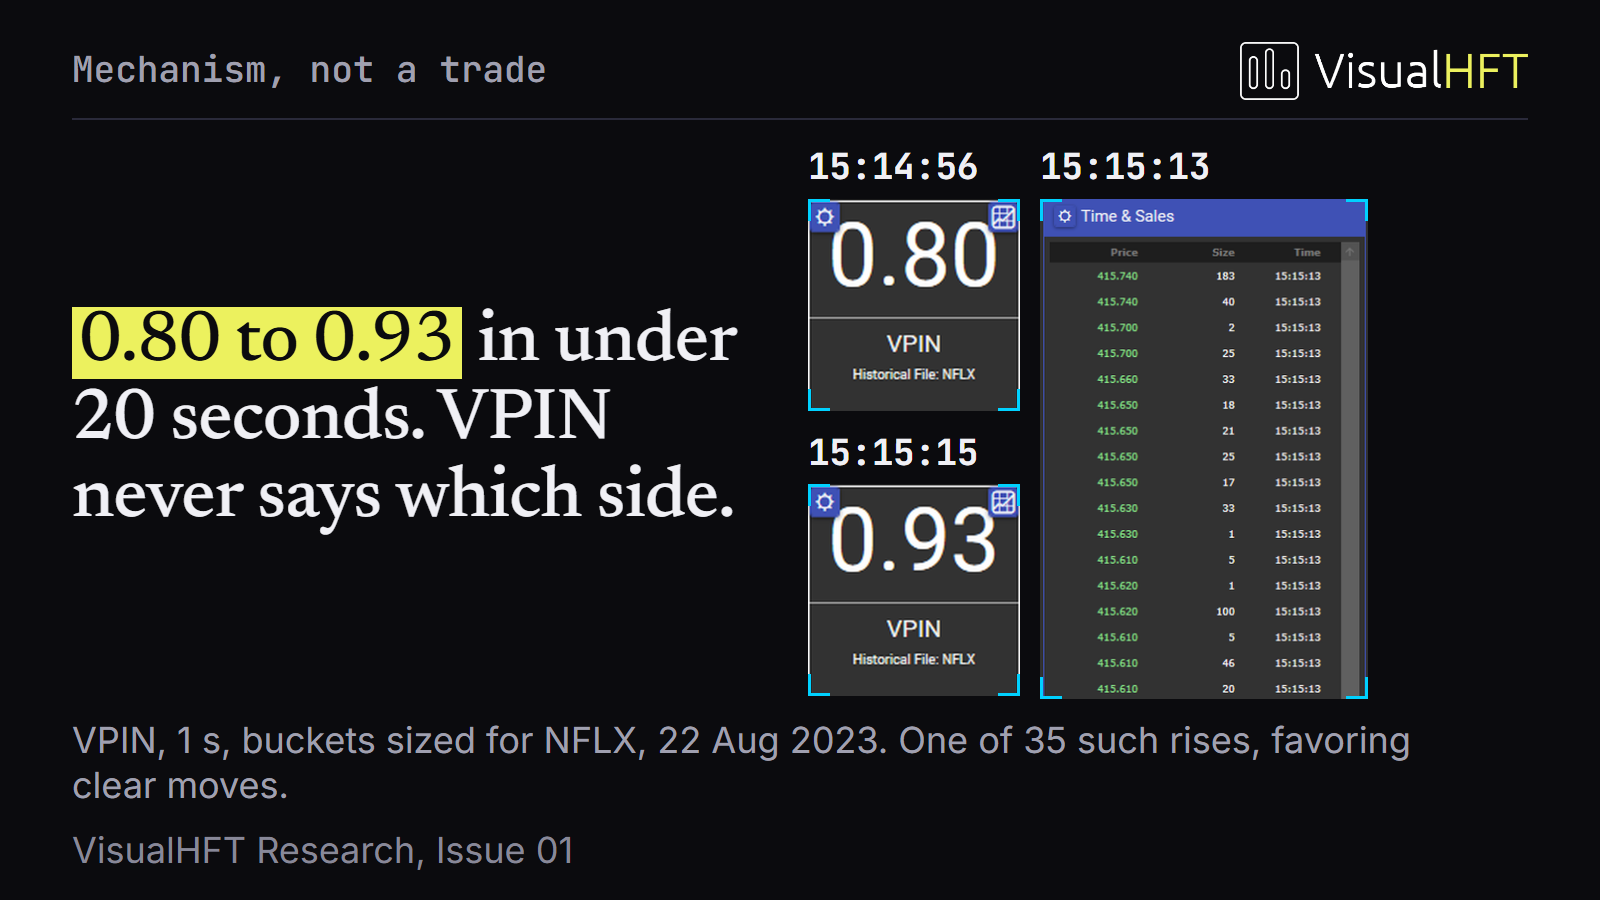
On equity feeds, the trade-to-trade tick rule correlates with short-horizon volatility across every active symbol. When VPIN climbs into the 0.70+ regime, one-sided flow is clustering on the tape. That is the signal to widen your passive spread and reduce resting quote size, not to bet on which way the next tick will print.
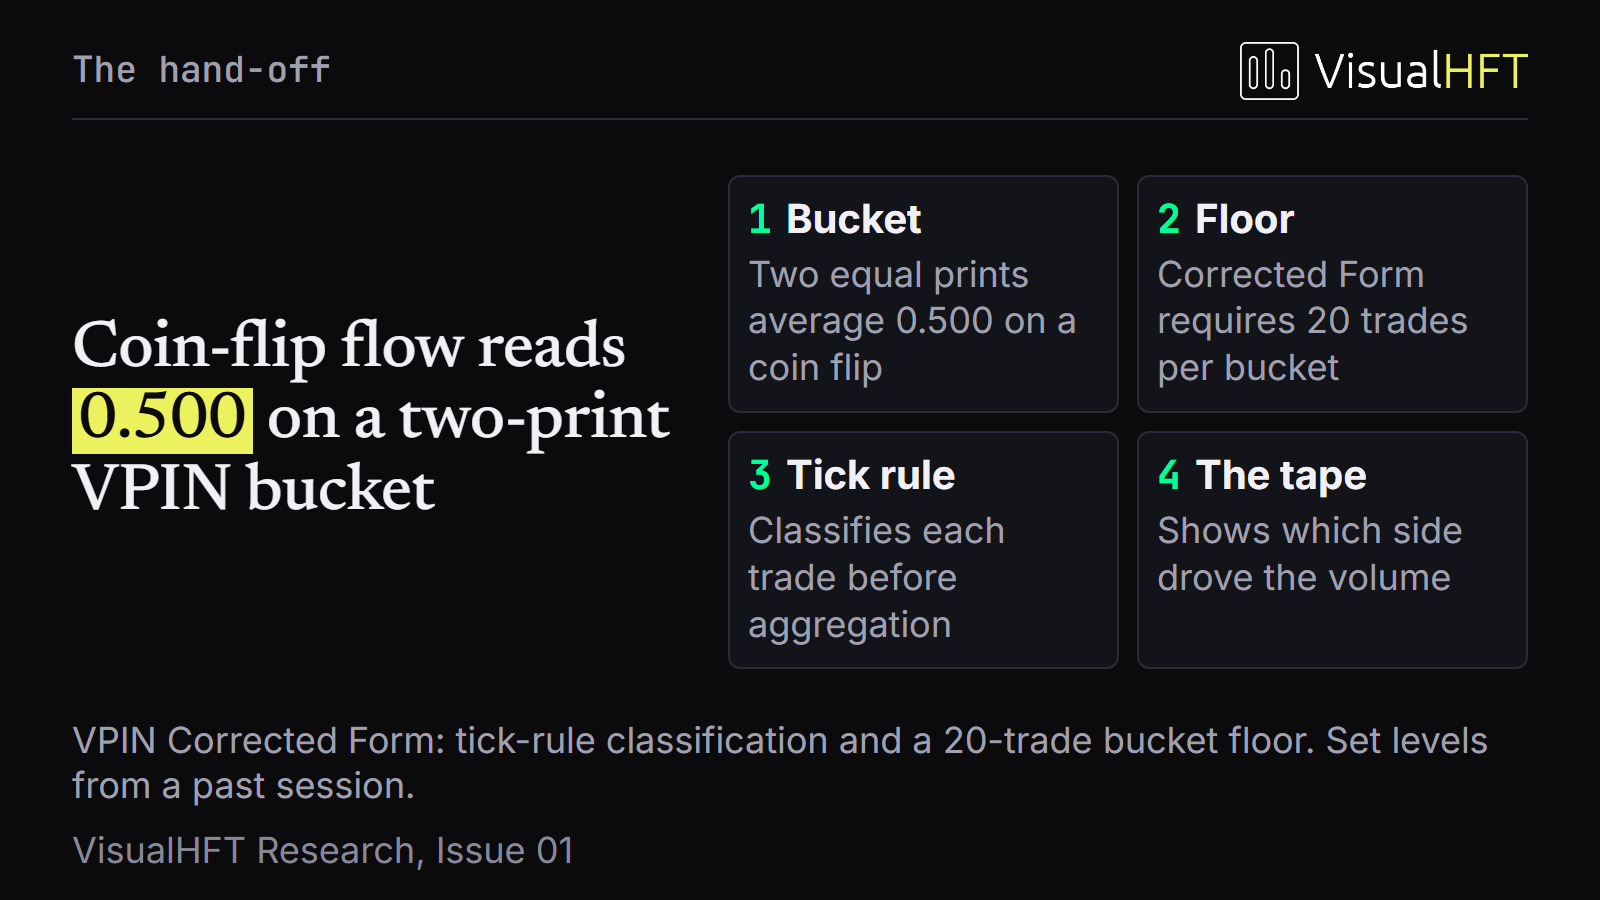
To make VPIN reliable across both ultra-liquid ETFs (QQQ, AAPL) and thinner mid-caps (IDXX, POOL), calibrate the bucket volume so each bucket aggregates at least 20 trades during regular trading hours, and wire true aggressor flags whenever your exchange feed provides them:
Market Resilience (MR) and Market Resilience Bias (MRB): Post-Sweep Diagnostics
Once a large sweep clears multiple price levels, a trader faces an immediate timing question: is liquidity snapping back into the book, or has the market repriced to a new level?
Market Resilience (MR) and Market Resilience Bias (MRB) act as post-shock state monitors that fire only after a genuine multi-part liquidity shock (a trade burst paired with a spread breakout and book depth depletion):
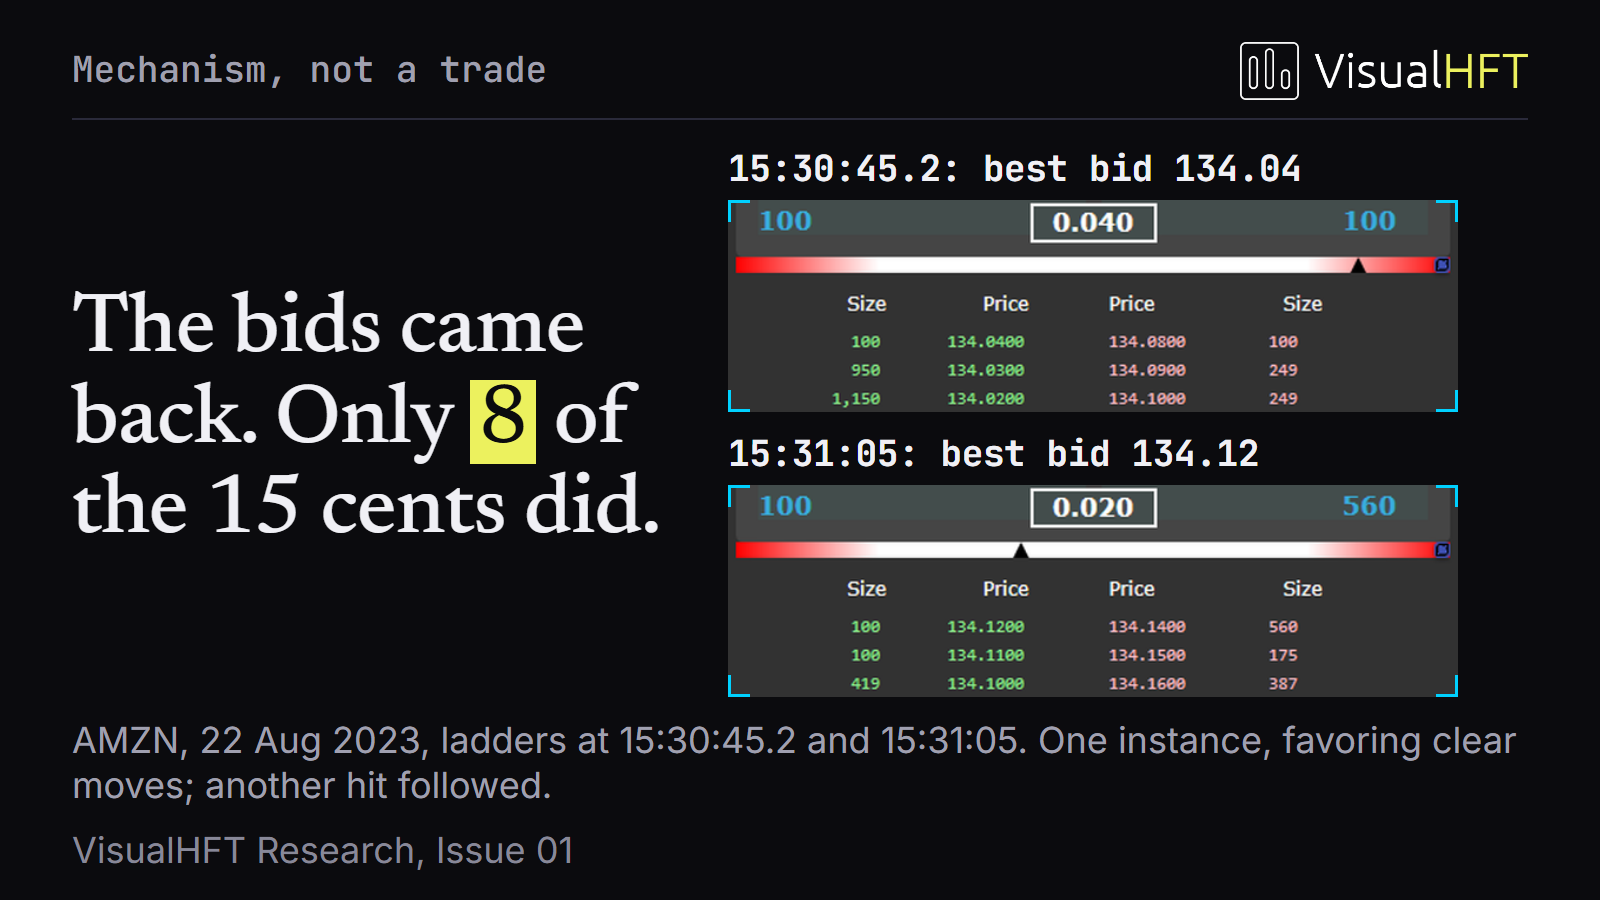
- Market Resilience (MR) tracks how quickly spread and depth recover relative to the symbol’s rolling historical recovery cadence. On AMZN at 15:30:45.2 ET, a sell sweep knocks the best bid down 15 cents to
$134.04and drops MR from0.4to0.3. Twenty seconds later at 15:31:05 ET, bids step back up to$134.12(recovering 8 of the 15 cents) and MR climbs to0.5, signaling that the spread-and-depth shock has stabilized.
- Market Resilience Bias (MRB) evaluates which side of the book is replenishing during that recovery window. In the same AMZN sequence,
MRBflips from↓during the sell sweep to↑at 15:31:05 ET once bid replenishment outpaces ask replenishment by more than30%:
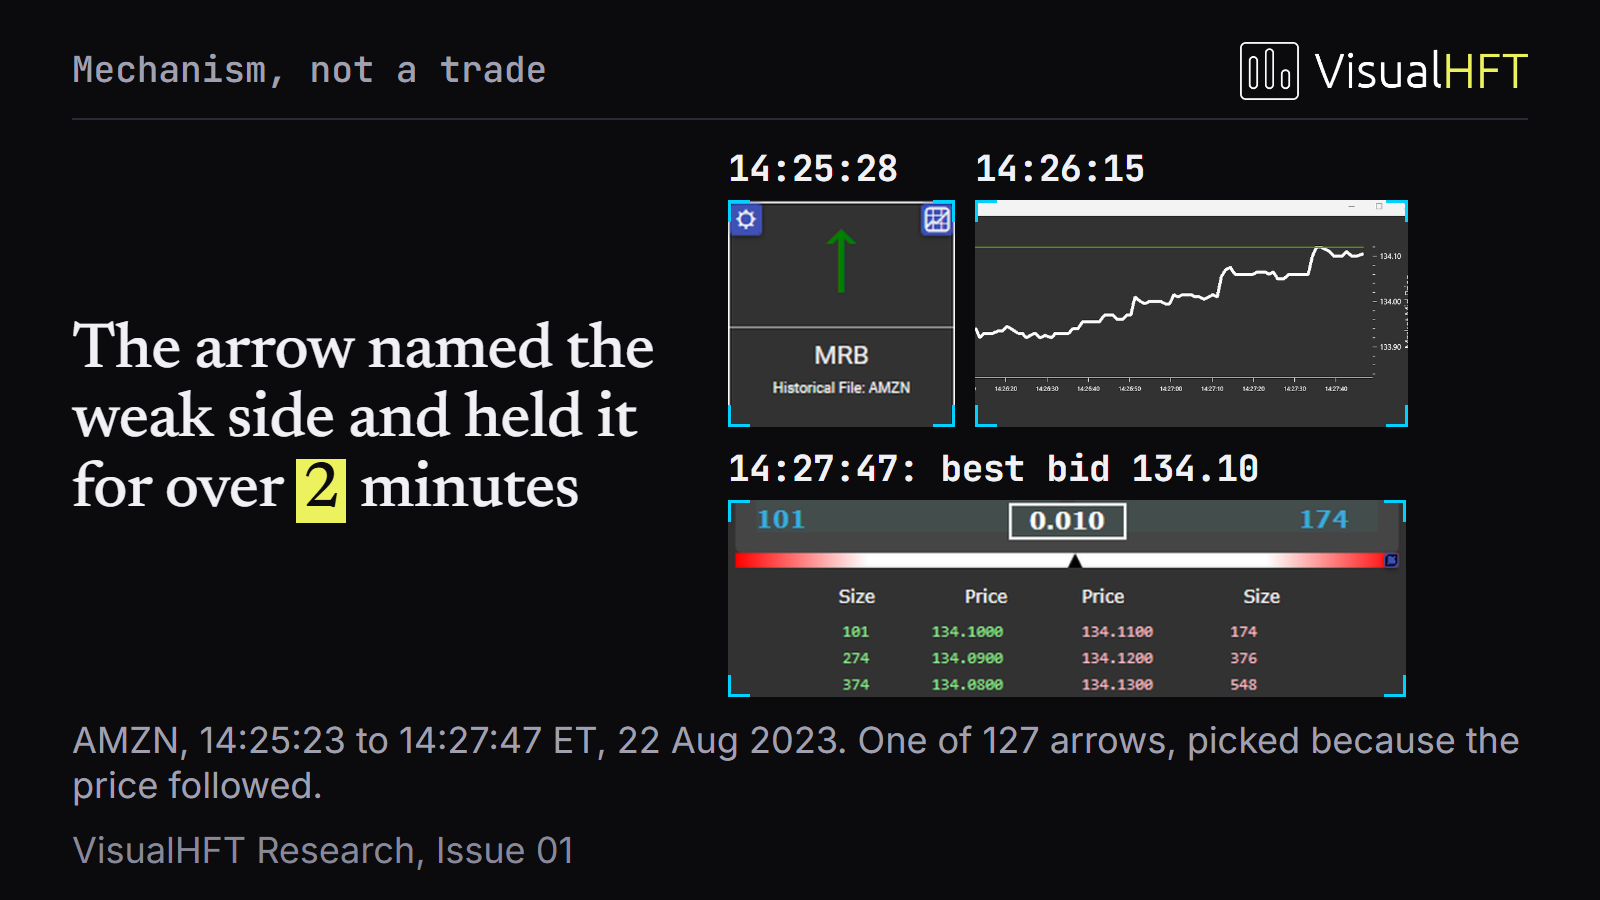
Because MR and MRB fire selectively on major book depletions (127 directional firings across 6,715 raw depth-thinning events in our 14-symbol session, with a median state hold of 30.0 seconds), desks use them as post-sweep re-entry gates: hold off on re-quoting while MR is depressed (< 0.35), and resume normal passive quoting once MR recovers above 0.50 and MRB confirms buyers or sellers are refilling the queue.
4. Putting the Tiles Together: A Multi-Signal Desk Matrix
Rather than watching any single number in isolation, combine the four tiles into a structured execution state check before sending or adjusting an order:
| Execution State | LOB Imbalance (Touch-Weighted) | VPIN (Toxicity Regime) | MR & MRB (Post-Sweep State) | Desk Action |
|---|---|---|---|---|
| Confirmed Reversal Entry | $\ge +0.5$ confirming bounce (or $\le -0.5$ confirming fade) | $< 0.60$ (Normal tape) | MR $\ge 0.50$ (Intact book) | Enter / Lean Passively: Post at the touch on the confirmed side (78.2% directional agreement on reversal). |
| Queue-Thinning Warning | Opposing lean passes $\pm 0.7$ against your resting order | Rising ($0.60 - 0.75$) | MR neutral | Skew / Step Back: Cancel or move your resting bid/offer back one tick before the thin touch gives way. |
| Toxic Sweep in Progress | Volatile / flipping | $> 0.75$ (High toxicity) | MR drops $< 0.35$ | Widen & Cut Size: One-sided volume is sweeping the book; widen passive spreads and wait for replenishment. |
| Post-Shock Stabilization | Rebuilding on touch | Cooling from peak | MR recovers $\ge 0.50$, MRB $\uparrow$ or $\downarrow$ | Re-quote on Replenished Side: Depth has absorbed the shock; resume quoting on the side confirmed by MRB. |
5. Automating the Workflow in the VisualHFT Trigger Engine
Watching four study tiles across a dozen symbols by eye works during a post-trade replay, but live desks let the VisualHFT Trigger Engine monitor those thresholds continuously and fire webhooks to their execution gateway the millisecond a multi-tile setup aligns.
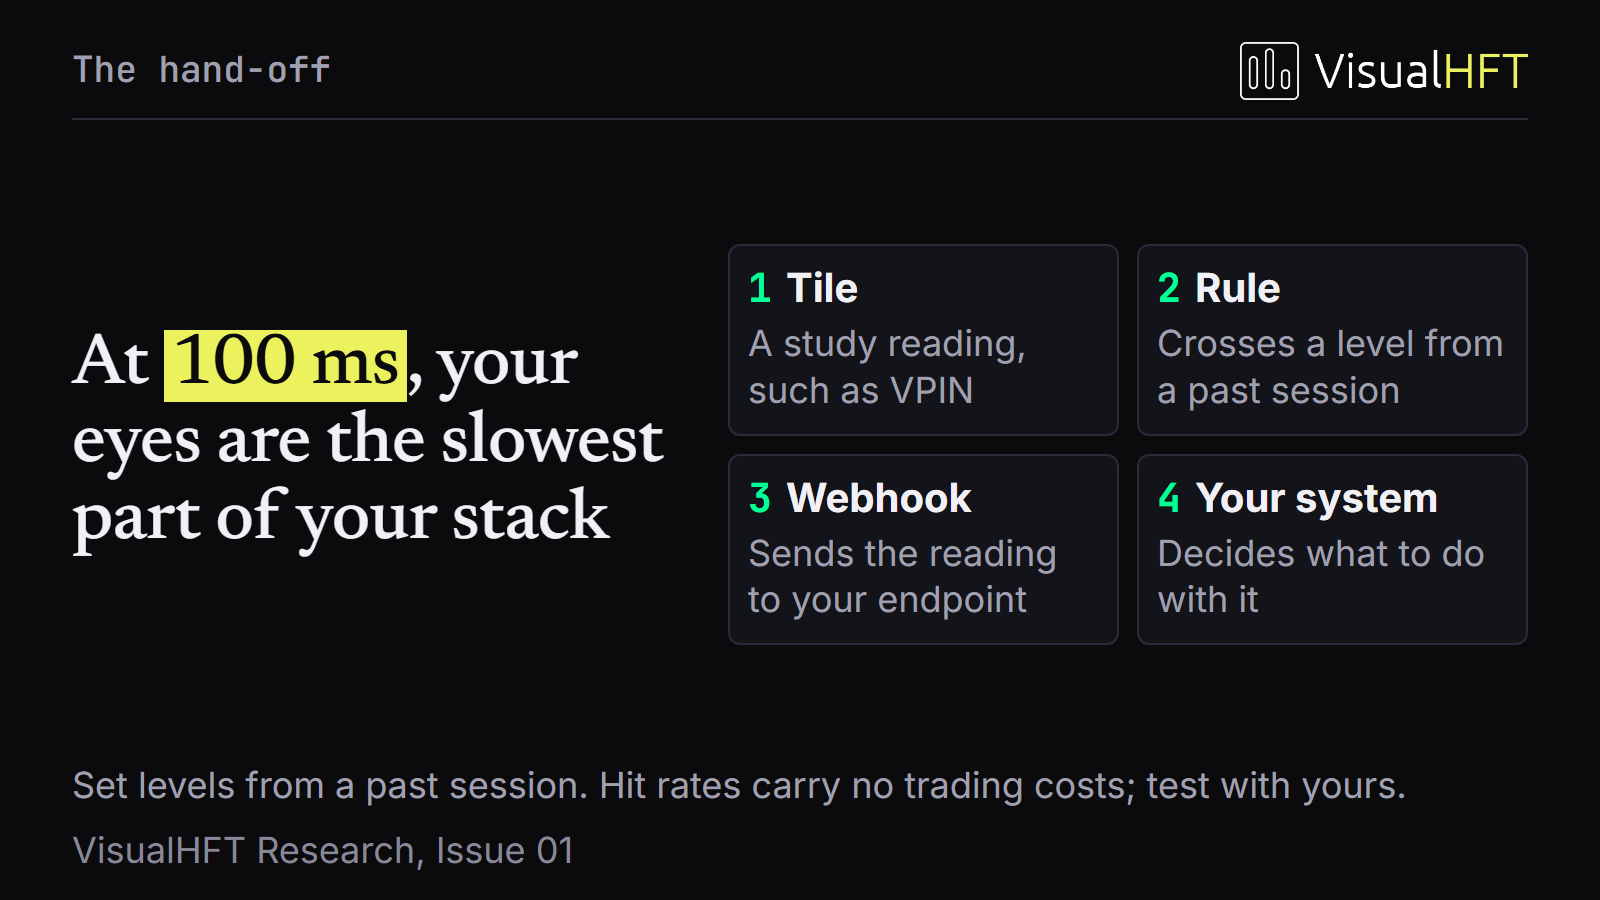
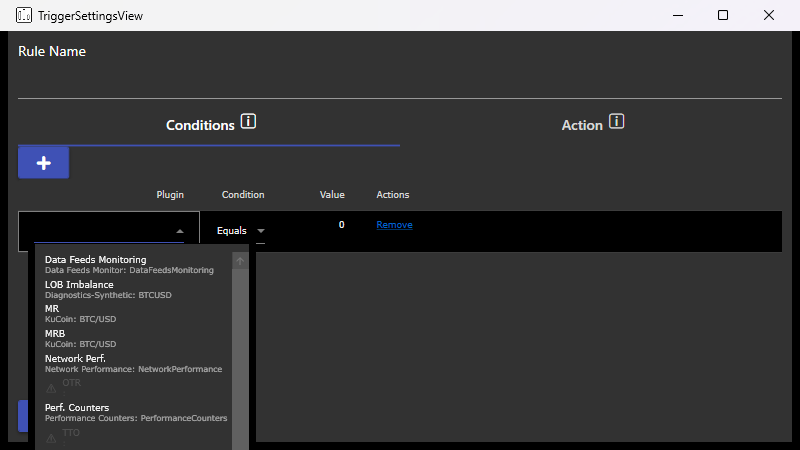
Every study plugin in VisualHFT publishes its live calculation into the central TriggerEngineService bus. You can chain multiple conditions together with an AND rule and attach a cooldown window so a noisy burst only fires once:
- Condition 1 (Near-Touch Lean): Select
LOB Imbalance, set the threshold toCrossesBelow -0.70(orCrossesAbove +0.70), and apply a2 Secondscooldown window. - Condition 2 (Regime Confirmation): Add a second condition on
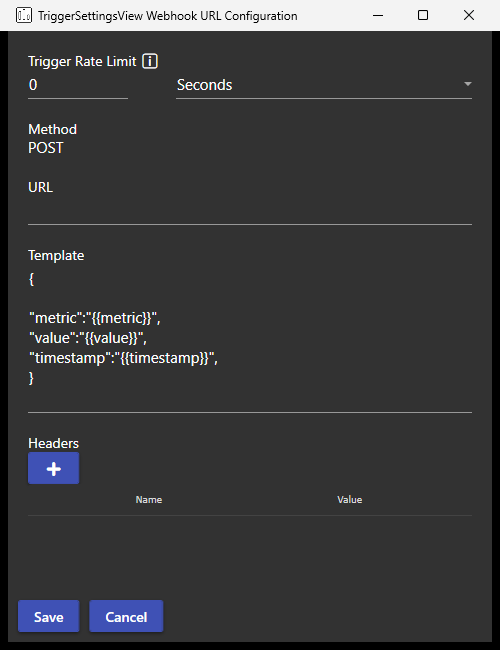
VPINorMarket Resilienceinside the same rule so the alert only fires when your toxicity or replenishment criteria are met. - Action (REST Webhook or UI Alert): Attach a REST webhook action with a structured JSON payload (
{{ruleName}},{{symbol}},{{metric}},{{value}},{{timestamp}}) that posts directly to your local order-management service, Python execution listener, or desk Slack channel.
Up Next in Part 2: The Signals That Say Stand Down
Part 1 covered how to confirm a directional entry, size passive quotes during toxic flow, and time post-sweep replenishment. Next week in Part 2, we turn to the two circuit-breaker tiles that tell an execution desk when to stand down completely: Order-to-Trade Ratio (OTR) and Trade-to-Order Ratio (TTO), showing how to distinguish genuine resting depth from high-speed cancel churn and aggressive book-clearing sweeps.
Want to inspect the full statistical scorecard, 20-level depth curves, and falsification tests behind every number in this guide? Read the companion research paper: Empirical Evaluation of LOB Imbalance, VPIN, and Market Resilience on NASDAQ TotalView-ITCH.