VisualHFT Research, Issue 01: One NASDAQ day, six tiles
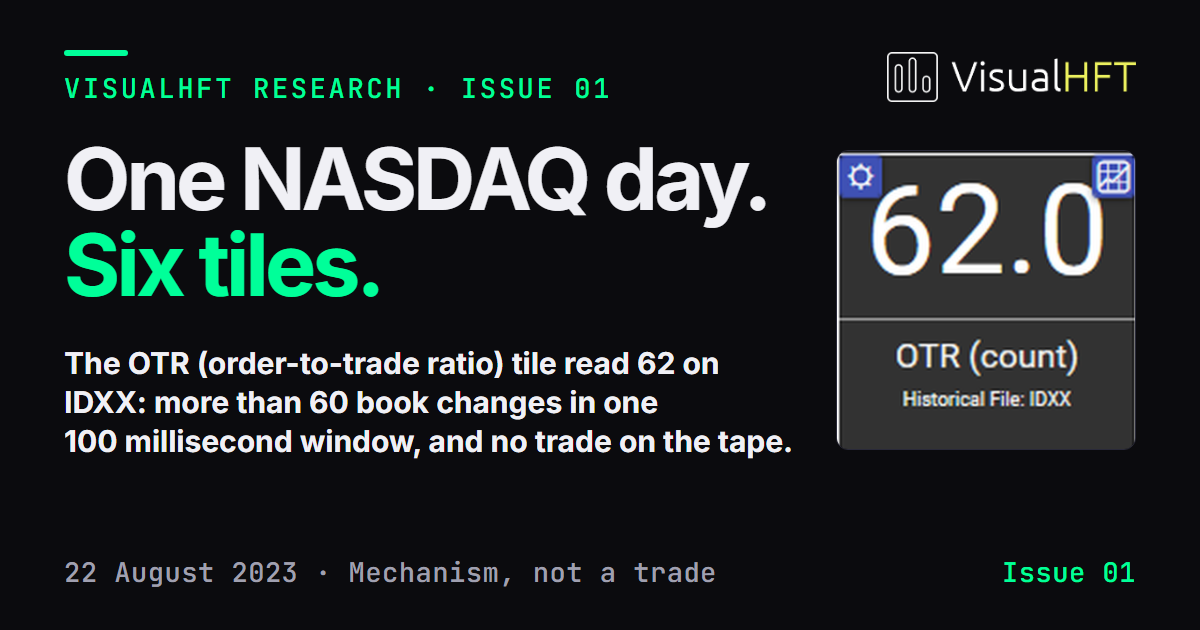
VisualHFT Research, Issue 01 is out: fourteen 16:9 spreads built from one NASDAQ TotalView-ITCH session, in a dark and a light edition. Here is what it adds to the article it grew from.
Ten symbols, one setting
The LOB (limit order book) Imbalance tile can read the book two ways. Equal Weight counts every captured level the same. Touch Weighted lets the levels nearest the best prices carry most of the weight. The article reports the pooled result; the issue breaks it out by symbol.
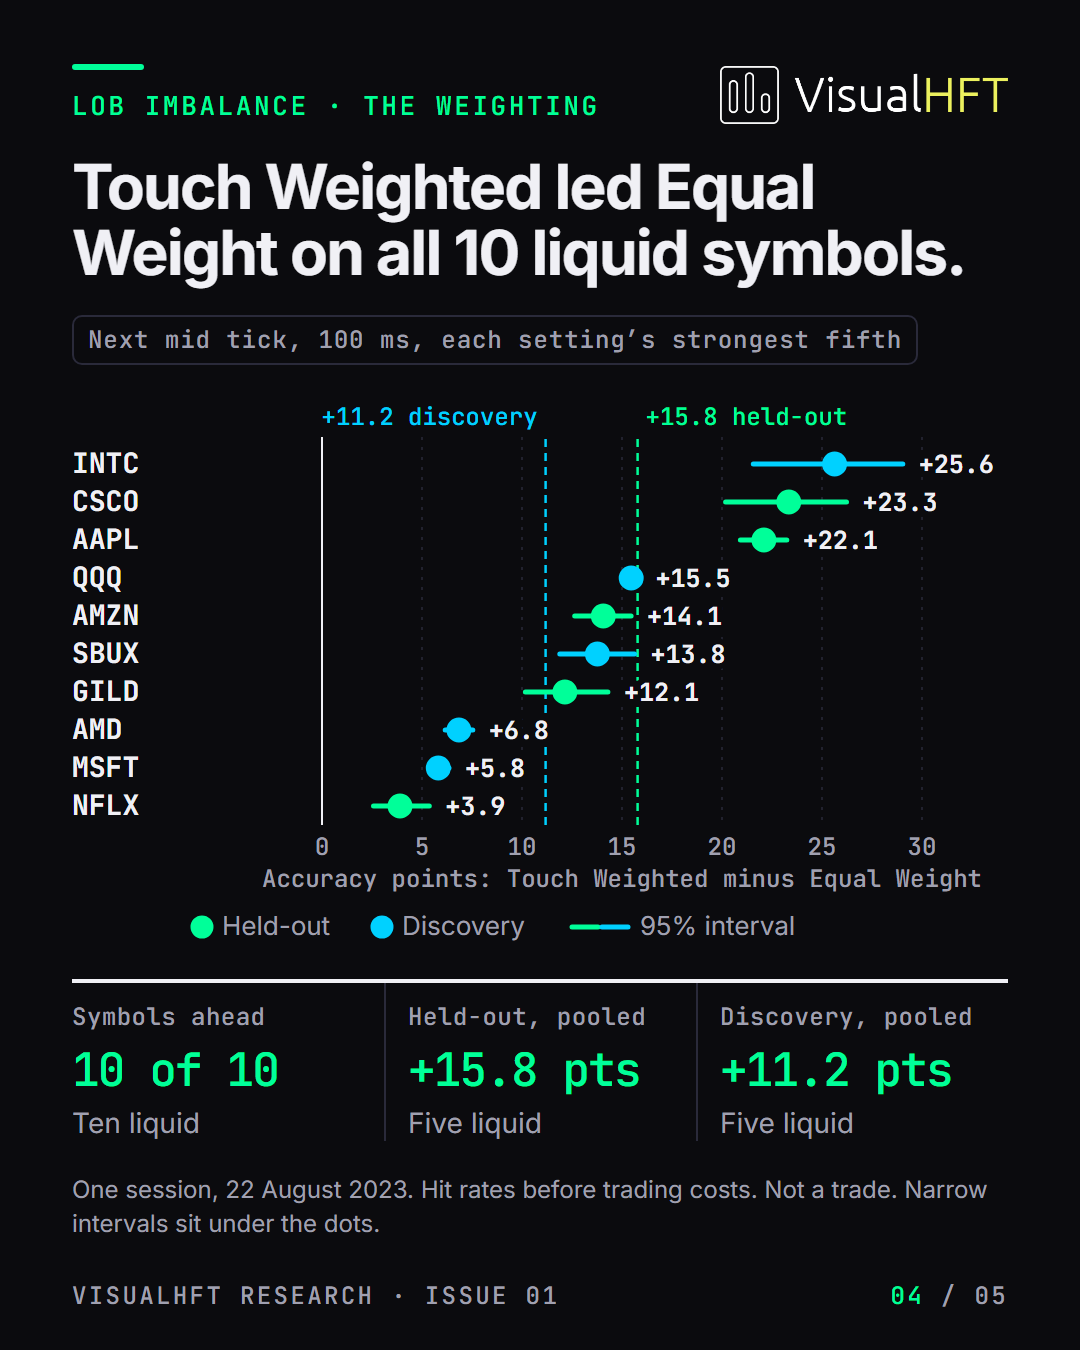
How it was scored: the next mid-price tick at 100 ms, each setting judged on its own strongest fifth of readings per symbol, on the session of 22 August 2023. Values are accuracy points, Touch Weighted minus Equal Weight, with 95% intervals. Hit rates before trading costs.
| Symbol | Group | Lead (points) | 95% interval |
|---|---|---|---|
| INTC | Discovery | +25.6 | 21.6 to 29.0 |
| CSCO | Held-out | +23.3 | 20.2 to 26.2 |
| AAPL | Held-out | +22.1 | 20.9 to 23.2 |
| QQQ | Discovery | +15.5 | 15.1 to 15.9 |
| AMZN | Held-out | +14.1 | 12.6 to 15.5 |
| SBUX | Discovery | +13.8 | 11.9 to 15.6 |
| GILD | Held-out | +12.1 | 10.2 to 14.3 |
| AMD | Discovery | +6.8 | 6.2 to 7.5 |
| MSFT | Discovery | +5.8 | 5.3 to 6.3 |
| NFLX | Held-out | +3.9 | 2.6 to 5.4 |
Every interval sits above zero; the lowest bound is NFLX at 2.6 points. The range is wide, +3.9 to +25.6, so the pooled figure averages over a lot of variation. The held-out symbols are not clustered: CSCO and AAPL sit near the top, NFLX at the bottom. Pooled, the lead is +15.8 points on the five held-out symbols (interval 14.9 to 16.6) and +11.2 on the five discovery symbols (10.9 to 11.5). INTC carries the widest interval, 21.6 to 29.0.
Two settings of one tile, one session. Not a trade.
How to read a capture
Every capture shows the same desk, in six regions:
- Quotes and ladder: bids and offers, price and size, ten levels per side.
- Study tiles: one study per tile, each read at its own aggregation level.
- Depth chart: resting size by price on both sides of the book.
- Order book chart: each price level through time, plus the best bid and offer.
- Study chart: the study’s value in green and, on most captures, the mid price in white.
- Time and Sales: the tape; green prints are marked buys, red prints sells.
On each spread, the left page holds the capture with numbered boxes, the magnified details they point to, and three figures; the boxed number between the two touch sizes is the spread. The right page holds the analysis, how often the captured picture appears across the day, a QR code to the capture, and a one-line takeaway.
What is inside the issue
- Spread 1: the cover.
- Spread 2: contents, and the reading guide above.
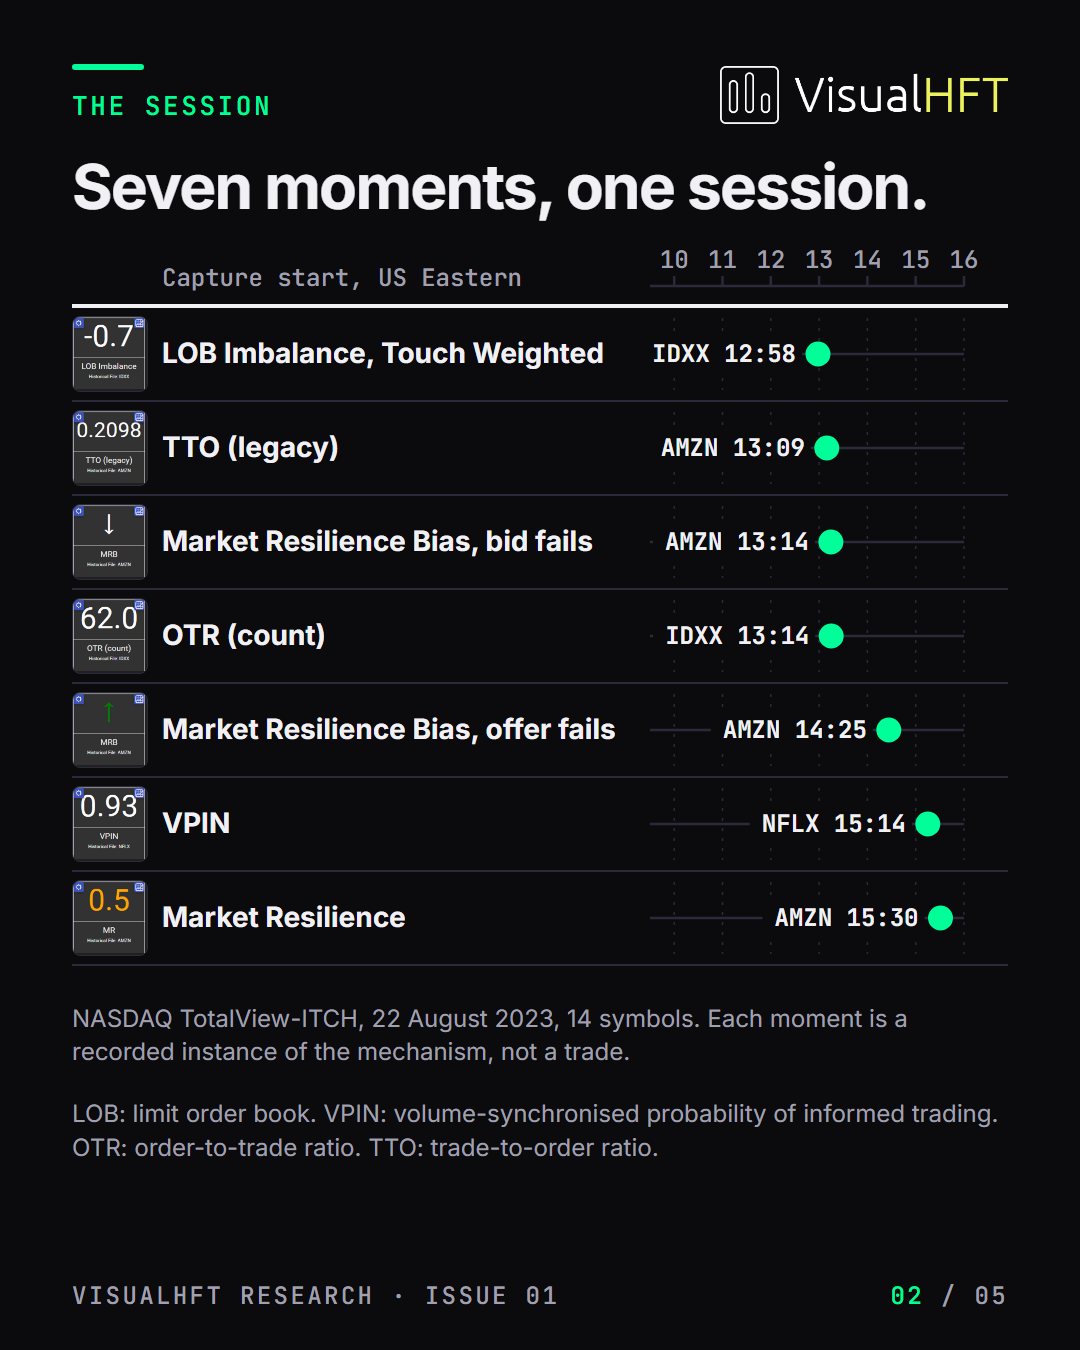
- Spread 3: the session on one timeline, and what each tile reads.
- Spreads 4 to 9: one tile each. LOB Imbalance, Touch Weighted (IDXX, 12:58); VPIN (NFLX, 15:14); Market Resilience (AMZN, 15:30); Market Resilience Bias (AMZN, 13:14 and 14:25); OTR (count) (IDXX, 13:14); TTO (legacy) (AMZN, 13:09). Every capture is a mechanism, not a trade.
- Spread 10: what we counted, and how we tested it.
- Spread 11: the ten-symbol comparison.
- Spread 12: from a tile to your own system.
- Spread 13: the final print.
- Spread 14: references and about.
From a tile to your own system
Spread 12 shows the hand-off: set a level on any study reading in VisualHFT Terminal, and your own system is called when the reading crosses it. What your system does with that call, and what it costs you, stays with you.
Read the issue
For the method, the full scorecard and the seven moments told pause by pause, read Six Study Tiles, One NASDAQ Day.
One session on one venue, hit rates before trading costs. Every capture is a mechanism, not a trade, and nothing here is investment advice.