Order-book imbalance and the next ten seconds
Most trading tools show you a number. Very few tell you whether that number has ever been right.
So we measured ours. VisualHFT ran against live Kraken BTC/USD twice, for 150 minutes and then for 90 minutes on a different part of the day. Each pass walked the desk and recorded what every study tile was displaying together with the limit order book’s own best bid and best ask. Afterwards we asked the recordings one question: when a tile read a certain way, what did the mid price do next?
One tile answered. Then we tried to destroy that answer, and what survived is smaller than what we started with.
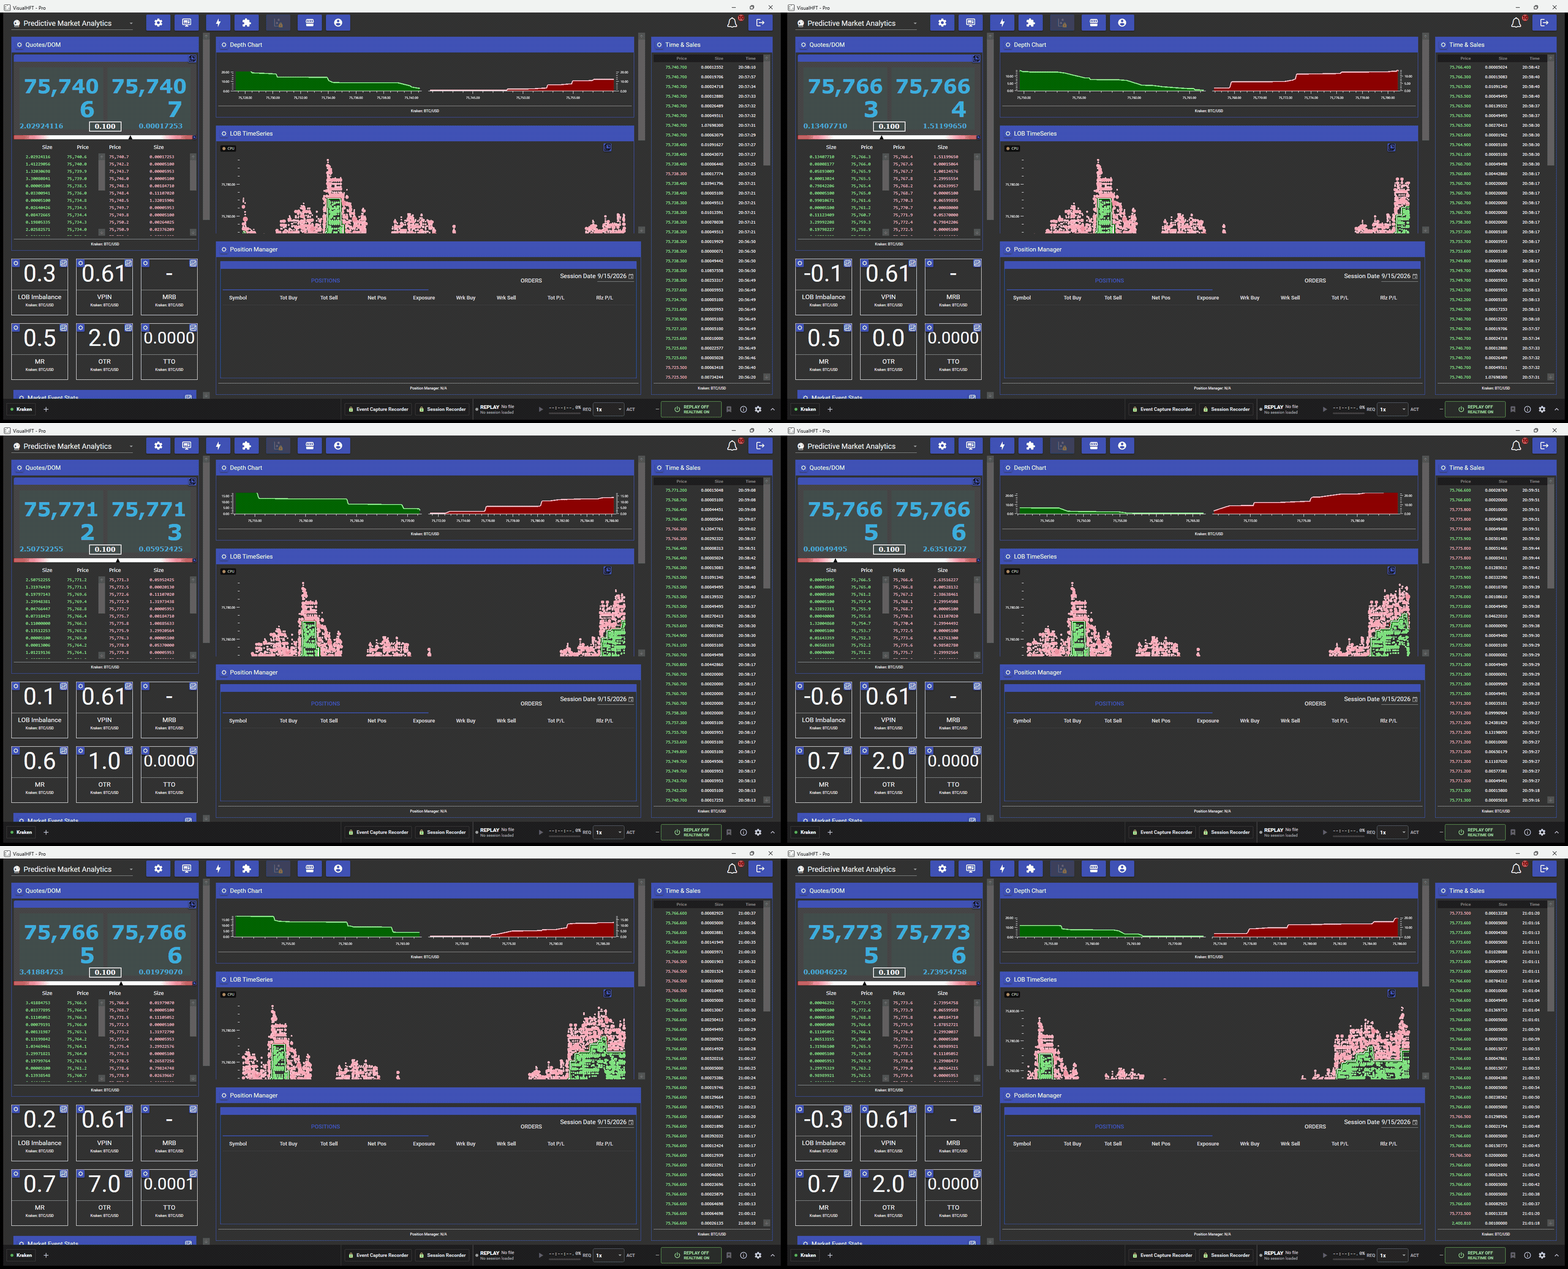
The desk this was recorded from. Ladder and top of book on the left, depth and the mid path in the centre, prints on the right, and the study tiles underneath.
How the recording works, and what that costs
A pass is a walk of the running application’s accessibility tree. It is not instantaneous: on these runs it took a median of 7.5 seconds and occasionally as long as 25. Every reading in a pass carries that pass’s single timestamp, so a tile value and a book price recorded together are within one walk of each other, not within one instant.
That matters for everything below, because the effect we found is itself only a few seconds long. We can measure that it decays fast. We cannot resolve exactly when it ends, and we will not pretend otherwise.
We also measured what the tile displays, which is rounded to one decimal. Across 1,020 passes the imbalance reading took only 19 distinct values. That is the number a trader actually sees, which is the point, but it is coarser than what the software computes internally.
What the imbalance tile computes
LOB Imbalance compares the size resting on each side of the limit order book:
(total bid size − total ask size) / (total bid size + total ask size)Both sums run over a configured number of levels, not the inside alone. The result sits between −1 and +1. Positive means more size resting on the bid, negative means more on the ask, and if either side is empty the tile shows 0.0.
Two things follow from that definition, and both matter. It is standing size, not traded volume. An order that cancels one update later still counted while it was resting. And it is not order-flow imbalance in the Cont, Kukanov, and Stoikov sense, which is built from book events at the best quotes. VisualHFT is measuring the size sitting in front of you right now.
The depth is set on the market connector, not on the study tile, which is worth knowing before you compare one desk’s readings to another’s.
What the recordings showed
We split each session into non-overlapping 30-second windows, bucketed every window by the imbalance reading at its start, and counted how often mid was higher at the end. Both sessions pooled:
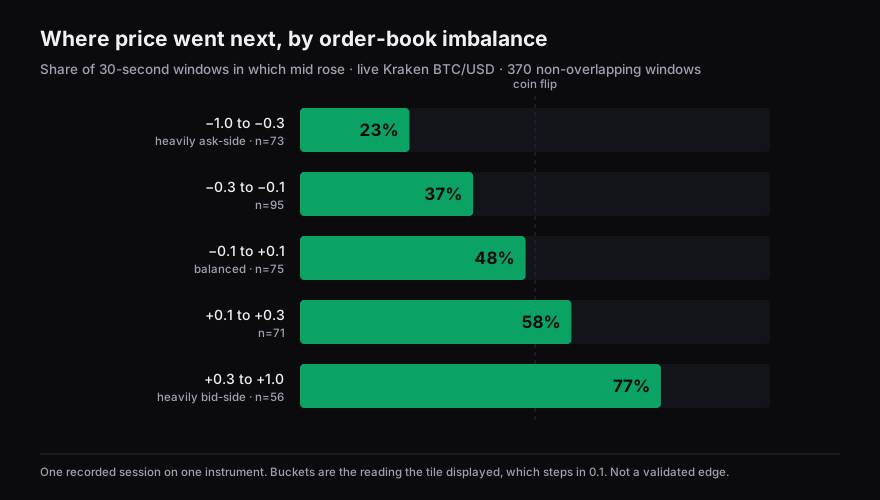
A balanced book lands at 48%, which is what a balanced book should do.
Those percentages are one draw, not constants. Slide the window grid in three-second steps and the most ask-side figure moves between 20% and 33%, the most bid-side between 63% and 84%, and the rank correlation between +0.21 and +0.43. The progression is monotonic across all five buckets in eight of the ten grid phases we tried. The direction is stable in every phase. The exact numbers are not.
It replicated
The two sessions were recorded hours apart, on different tape, and analysed separately.
| Session 1 (150 min) | Session 2 (90 min) | |
|---|---|---|
| Non-overlapping windows | 225 | 145 |
| LOB Imbalance | +0.34 (p < 0.0001) | +0.32 (p = 0.0001) |
| VPIN | −0.03 (p = 0.62) | −0.02 (p = 0.77) |
| OTR | +0.06 (p = 0.35) | +0.11 (p = 0.19) |
These sessions were recorded with the OTR study in its message-count form, which is the default.
Correlations of +0.34 and +0.32 on independent data are the most reassuring thing in this piece. One session is an anecdote.
Where the effect actually lives
The obvious way to test duration is to compare 15, 30, and 60-second windows. It does not work, and the reason is worth showing: those windows are nested. A 30-second window contains its own first 15 seconds; a 60-second window contains the first 30. All three can be detecting a single short move near the start, and a spurious effect there would appear in all three by construction.
The test that does discriminate is to delay the clock: take the reading at time t, then measure a fixed 30-second move starting at t + k, discarding everything in between.
| Return window starts | Session 1 | Session 2 |
|---|---|---|
| immediately | +0.34 (p < 0.0001) | +0.32 (p = 0.0001) |
| 5 seconds later | +0.28 (p = 0.0001) | +0.21 (p = 0.011) |
| 10 seconds later | +0.17 (p = 0.016) | +0.10 (p = 0.26) |
| 15 seconds later | +0.04 (p = 0.58) | +0.11 (p = 0.22) |
| 20 seconds later | +0.10 (p = 0.15) | +0.11 (p = 0.21) |
What this supports, stated precisely: the relationship decays measurably within the first ten seconds and is indistinguishable from chance by fifteen. At ten seconds it is weakened but still there in session 1. The rows at 15 and 20 seconds bounce around within noise of each other and of zero, and given a 7.5-second measurement pass the data cannot resolve the boundary more finely than that.
So the tile is telling you about the next few seconds, not the next half minute.
The awkward part of the literature
It is tempting to file this alongside Gould and Bonart, who found queue imbalance to be a one-tick-ahead predictor on NASDAQ, and Lipton, Pesavento, and Sotiropoulos, who modelled the probability of the next price change from imbalance at the top of book. Both describe a very short-lived effect, which is what we found.
But both measure imbalance at the best quotes only. This tile sums across depth. The paper measuring the same construct we are measuring is Cao, Hansch, and Wang, who looked at depth behind the inside on the Australian Stock Exchange, and they found their result over five-minute returns.
That is the honest benchmark, and it disagrees with us. Different market, different instrument, different era, and a real disagreement about horizon that one afternoon of Kraken BTC/USD does not settle.
Does the book lead price, or follow it?
This is the first objection a practitioner will raise, so here is the answer before you have to ask.
Correlate the same reading against the move that already happened and it scores higher than against the move that follows: +0.48 versus +0.35 in session 1, +0.43 versus +0.31 in session 2. Taken alone, that looks like a tile reacting to price rather than anticipating it.
It does not survive the control. The partial rank correlation between the reading and the forward move, holding the preceding move fixed, is +0.33 in session 1 and +0.32 in session 2. In session 1 no shuffle out of 20,000 reached the observed value. The backward relationship is real and larger. The forward one is not explained by it.
The other tiles, and three results we are throwing away
We ran the same test against VPIN, Market Resilience, Order-To-Trade, and Trade-To-Order, on both the direction of the next move and its size.
Market Resilience Bias is absent from that list because it was not testable. It renders an arrow or a dash rather than a number, and across both sessions it showed a dash the entire time. We recorded no direction from it, which is not the same as recording no relationship.
Three readings crossed the 5% line. Order-To-Trade against direction at 60 seconds in session 1. Order-To-Trade against move size at 30 seconds in session 1. VPIN against move size at 30 seconds in session 2. None of the three reproduced in the other session. Roughly thirty tests were in play across four testable tiles, four horizons, and two targets, and three unreplicated hits is what thirty tests produce on their own. We are reporting them so you can see the discipline, not because we believe them.
The deeper point is that a directional test is the wrong test for most of these. Imbalance is a signed quantity: it points somewhere. The others are unsigned magnitudes. A high toxicity reading does not mean “up”, it means the tape has been one-sided. A low resilience score does not mean “down”, it means the book is slow to refill after a large trade. Asking a magnitude to predict direction is asking it to do something it is not shaped to do.
| Tile | The question it answers |
|---|---|
| VPIN (Volume-Synchronised Probability of Informed Trading) | How one-sided has recent volume been? A gate on adding size, not on which way to lean. |
| MR (Market Resilience) | How quickly does the book recover after a large trade? A gate on when to re-enter. |
| MRB (Market Resilience Bias) | Which side did that recovery favour? An arrow or a dash, and only meaningful after a shock. |
| OTR (Order-To-Trade) | How much order activity per trade? The tile shows that ratio minus one, counting book messages by default, or posted size if you switch the setting. A warning about resting passive orders. |
| TTO (Trade-To-Order) | How much volume actually trades per unit of displayed order volume? A warning that most flow is placed and pulled, not filled. |
Acting on it without watching it
A signal that lives for a few seconds is a signal you will miss by hand. Any study that emits a metric can drive the trigger engine.
Open Trigger Rules, add a rule, and on the Conditions tab pick the study, the operator, and the number. The operators appear as Equals, GreaterThan, LessThan, CrossesAbove, and CrossesBelow. The first three fire while the reading is already past the number, and re-fire once per cooldown while it stays there. The crossing operators fire on the change itself.
One detail here is worth stating plainly. The tile rounds to one decimal for display. The trigger engine receives the raw, unrounded value. A rule set at 0.6 is compared against something like 0.5837, not against the 0.6 on screen. Treat the tile as a readout, not as the number your threshold meets. For the same reason, Equals is exact and is not usable on a continuous metric like this one.
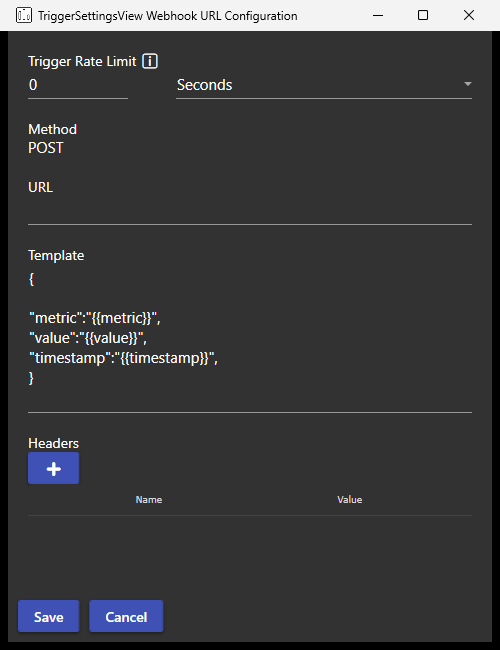
On the Action tab a rule can notify in-app, post to a webhook, or both. Configure beside Webhook URL opens the Webhook URL Configuration dialog shown above: the method is POST, and you supply the URL, a JSON body template, and any headers you need. The trigger rate limit is the cooldown, applied per action rather than per rule, so a reading that flickers around your threshold does not flood the endpoint.
The dialog opens with a starter template, and the placeholders in that starter have changed between releases. The engine substitutes {{rulename}}, {{condition}}, {{threshold}}, {{value}}, {{timestamp}}, and the metric name, which is available as {{metric}} on current builds and as {{plugin}} on every version ever shipped. If you want a template that survives upgrades in both directions, use {{plugin}}. Substitution happens in the body only, so the URL and headers are sent exactly as you type them. There is no symbol or venue token, so encode the instrument in the URL or a header if your endpoint needs it.
That is how a reading that lives for seconds leaves the screen and reaches whatever already sends your orders.
What this is and is not
Two recorded sessions, one instrument, one venue, 240 minutes of wall clock, 370 non-overlapping windows. Windows that could not be matched to a price sample at both ends were dropped, so the analysed windows cover rather less than the elapsed time. Eight of the 946 price reads in session 1 showed a spread wider than one tick and are probably misreads; removing them moves the headline correlation from +0.34 to +0.32 and changes nothing else.
It is a description of what happened on one day, not a validated edge, and not a claim about any other instrument, venue, or period. We have shown you the phase sensitivity, the backward correlation, and the three results we discarded, because those are the first things we would attack if someone else published this.
VisualHFT does not route orders and does not advise on trades. It shows you the book you are about to trade and the readings taken from it.
The papers give the relationship. These recordings give two measurements of it, through the same tile that ships in the product. Neither gives you the threshold for your instrument. That number is yours to find, and now there is a way to watch it being right or wrong.
View the documentation to point a tile at a venue and a symbol.
Related reading: limit order book imbalances, VPIN and real-time order toxicity, and market resilience in trading strategies.