Your first session: from empty dashboard to live data
What to do in the first ten minutes after installing VisualHFT Terminal. How the dashboard is built, how to connect a market connector, how to point each tile at a provider and a symbol, and which plugins are included versus bought separately.
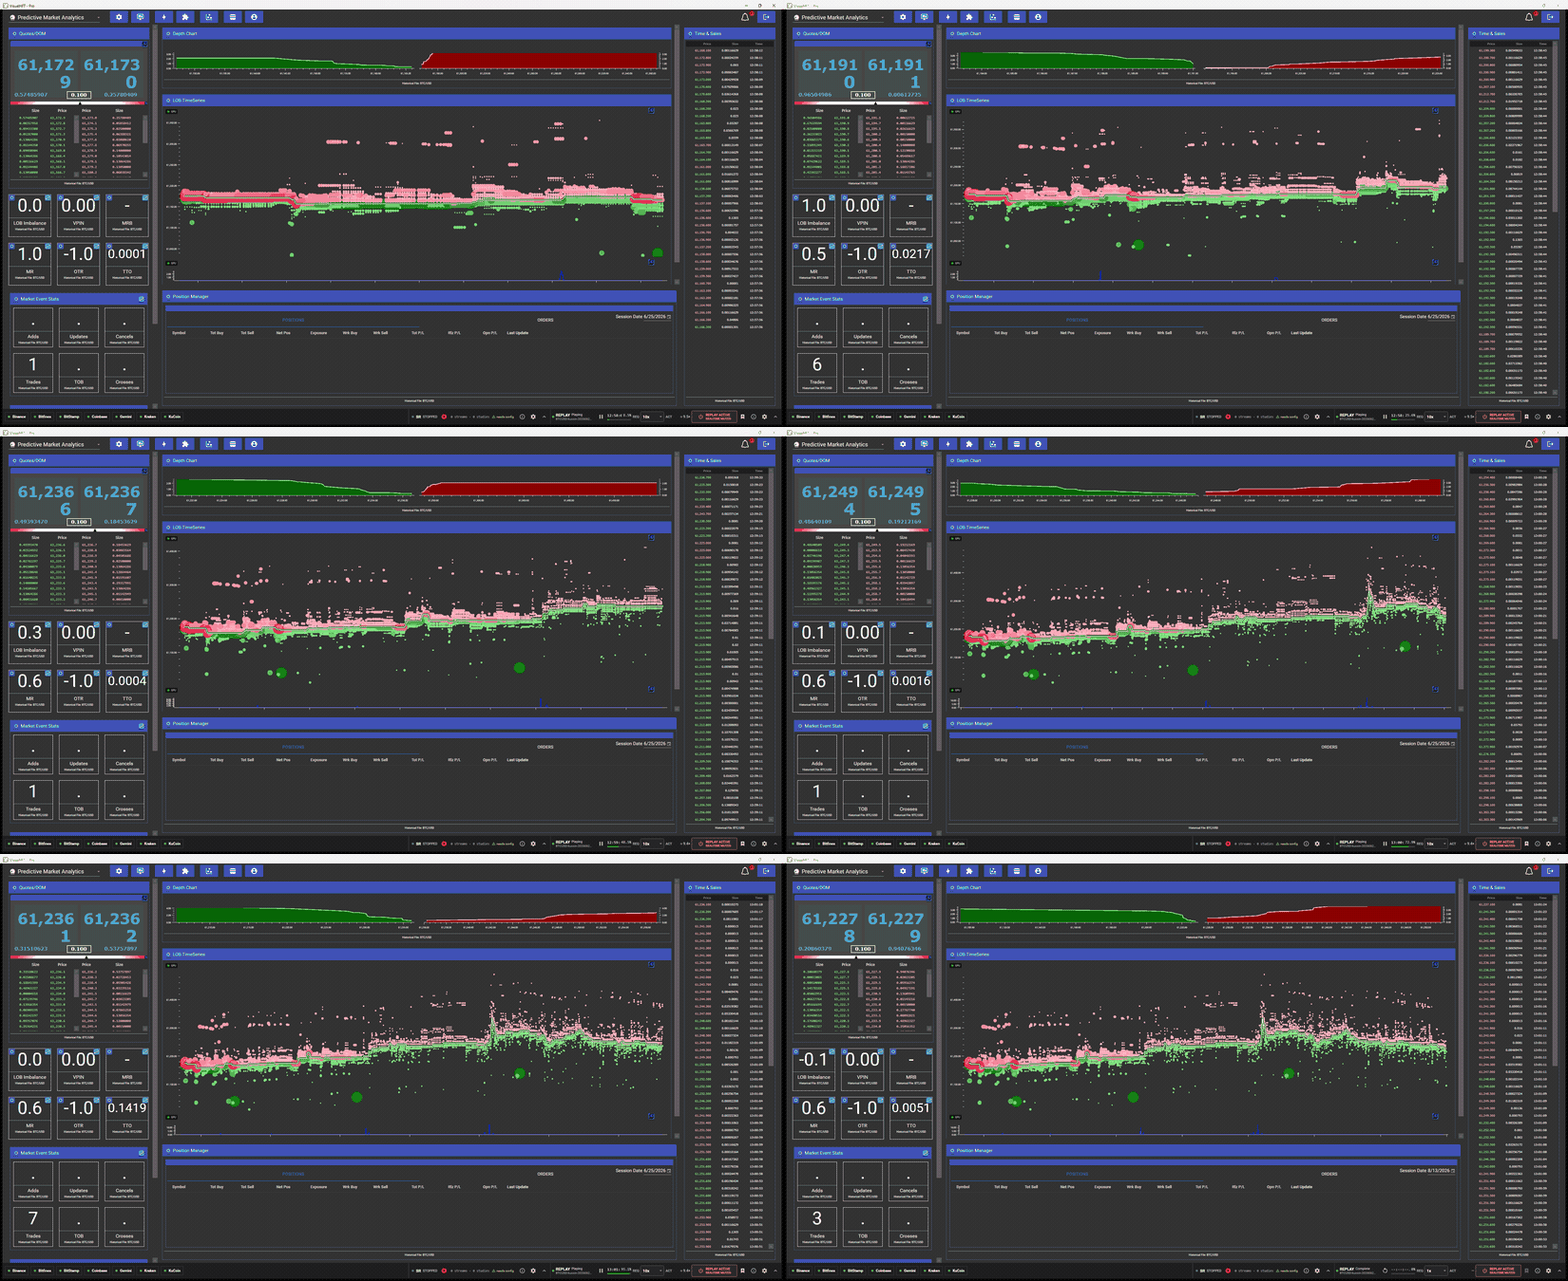
You have installed VisualHFT Terminal and signed in. This page is the ten minutes that takes you from a fresh install to a dashboard filling with live market data.
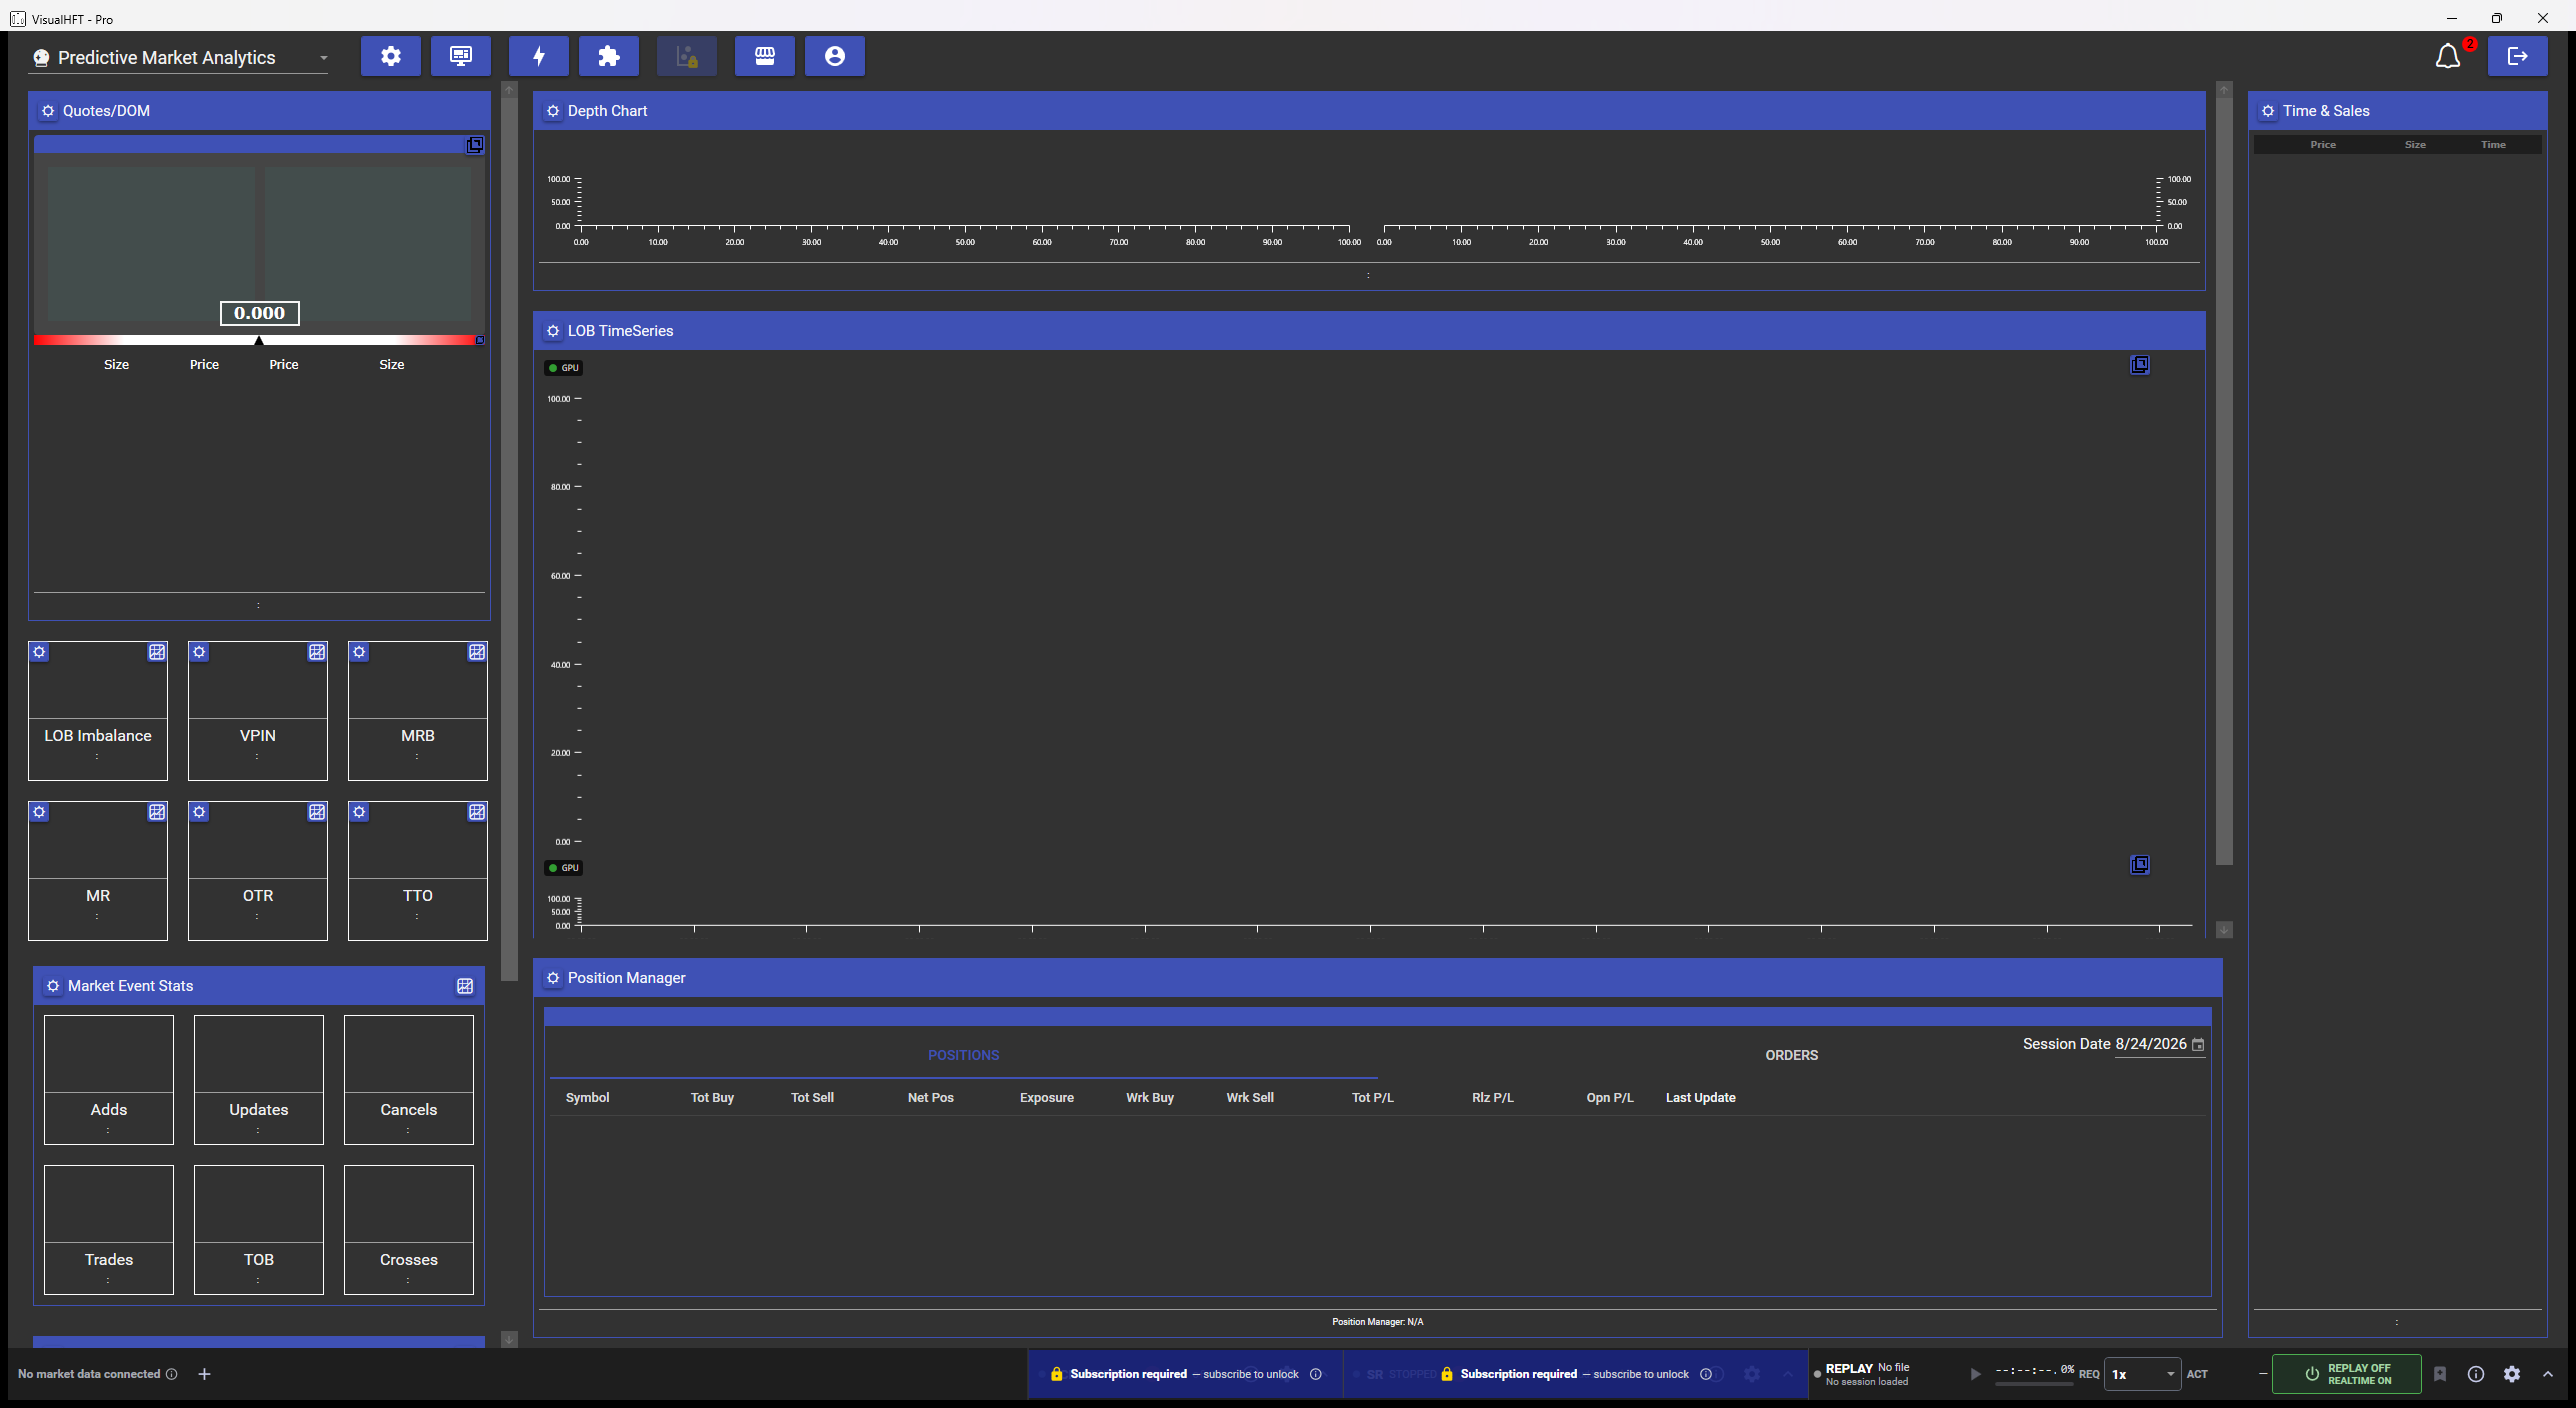
Two things have to happen, in this order:
- Connect a market connector. Nothing connects by itself on a fresh install.
- Point each tile at one provider and one symbol. Each tile starts producing as soon as you tell it which venue and which instrument to watch.
Everything else on this page is detail underneath those two steps.
What you are looking at
The shell has four regions, and they never move. The layout is fixed in code, not arranged by you.
| Region | What lives there |
|---|---|
| Top bar | The dashboard picker on the left, then Application Settings, System Diagnose Dashboard, Trigger Management, Plugins Management, Microstructure Diagnostics, Marketplace and User Profile. The notification bell and Logout are pinned far right (View/DashboardL3.xaml:234-327) |
| Left column | A fixed 500 unit column of small metric tiles and tile groups (View/DashboardL3.xaml:367) |
| Centre | The large panels: charts, ladders, tables. Scrolls when it overflows |
| Right column | A fixed 320 unit column holding whatever tiles that dashboard assigns to it, which is Time and Sales on the default dashboard and nothing at all on Infrastructure Monitoring (View/DashboardL3.xaml:556) |
| Footer | The provider rail: a chip for each connected venue, as many as fit with the rest behind an overflow button, a + that opens the venue catalog, and the recorder and replay consoles in their own region to the right (View/DashboardL3.xaml:364, View/ucProviderRail.xaml:161-170) |
Those widths are WPF device-independent units, so at 150 percent display scaling the left column occupies 750 physical pixels rather than 500.
The anatomy of a tile
A standard metric tile has four parts, and three of them are how you diagnose it
(UserControls/MetricTile.xaml:40-63):
- the value, large, in the upper half;
- the title underneath it;
- a footer line reading
Provider: Symbol, which is the tile’s own report of what it is configured to watch; - a gear in the top left corner that opens that tile’s settings, and, on tiles that keep history, a chart icon in the top right.
The footer line is the single most useful thing on the tile. If it is empty, or names a venue you are not connected to, you have your answer before you have looked at anything else.
Not every tile carries all four. Each study decides whether its gear, chart icon and footer appear
(ViewModel/vmTile.cs:99-101), the launcher tiles switch all three off, and counter groups are a
different control entirely: a titled box whose single gear sits in the group header and configures
every counter inside it at once (UserControls/MetricTileGroup.xaml:37, ViewModel/vmTile.cs:111).
Step 1: connect a market connector
Which build this describes. The footer provider rail, and the rule that only previously connected venues start, arrived after release v0.1.11. If your footer is a plain connectivity strip with no
+button, you are on v0.1.11 or earlier: every connector starts automatically there, and you manage them from Plugins Management in the top bar instead. Everything else on this page applies to both.
On a fresh install nothing is connected. VisualHFT starts only the connectors you left connected
last time, and on a first run that list is empty (PluginManager/PluginManager.cs:320-330). The
footer says No market data connected (View/ucProviderRail.xaml:197-198). Hover the information
icon beside it and it explains that no market connector is running, that studies, charts and tiles
therefore have no live prices to work from, and that this is the normal state on a first run because
VisualHFT no longer starts every venue automatically (View/ucProviderRail.xaml:243-252).
Click the + at the end of the chip strip, to the left of the recorder and replay consoles. The
venue catalog opens with a search box and one row per connector, each row carrying a status dot, the
venue name, a connect switch and a settings gear (View/ucProviderRail.xaml:500-573).
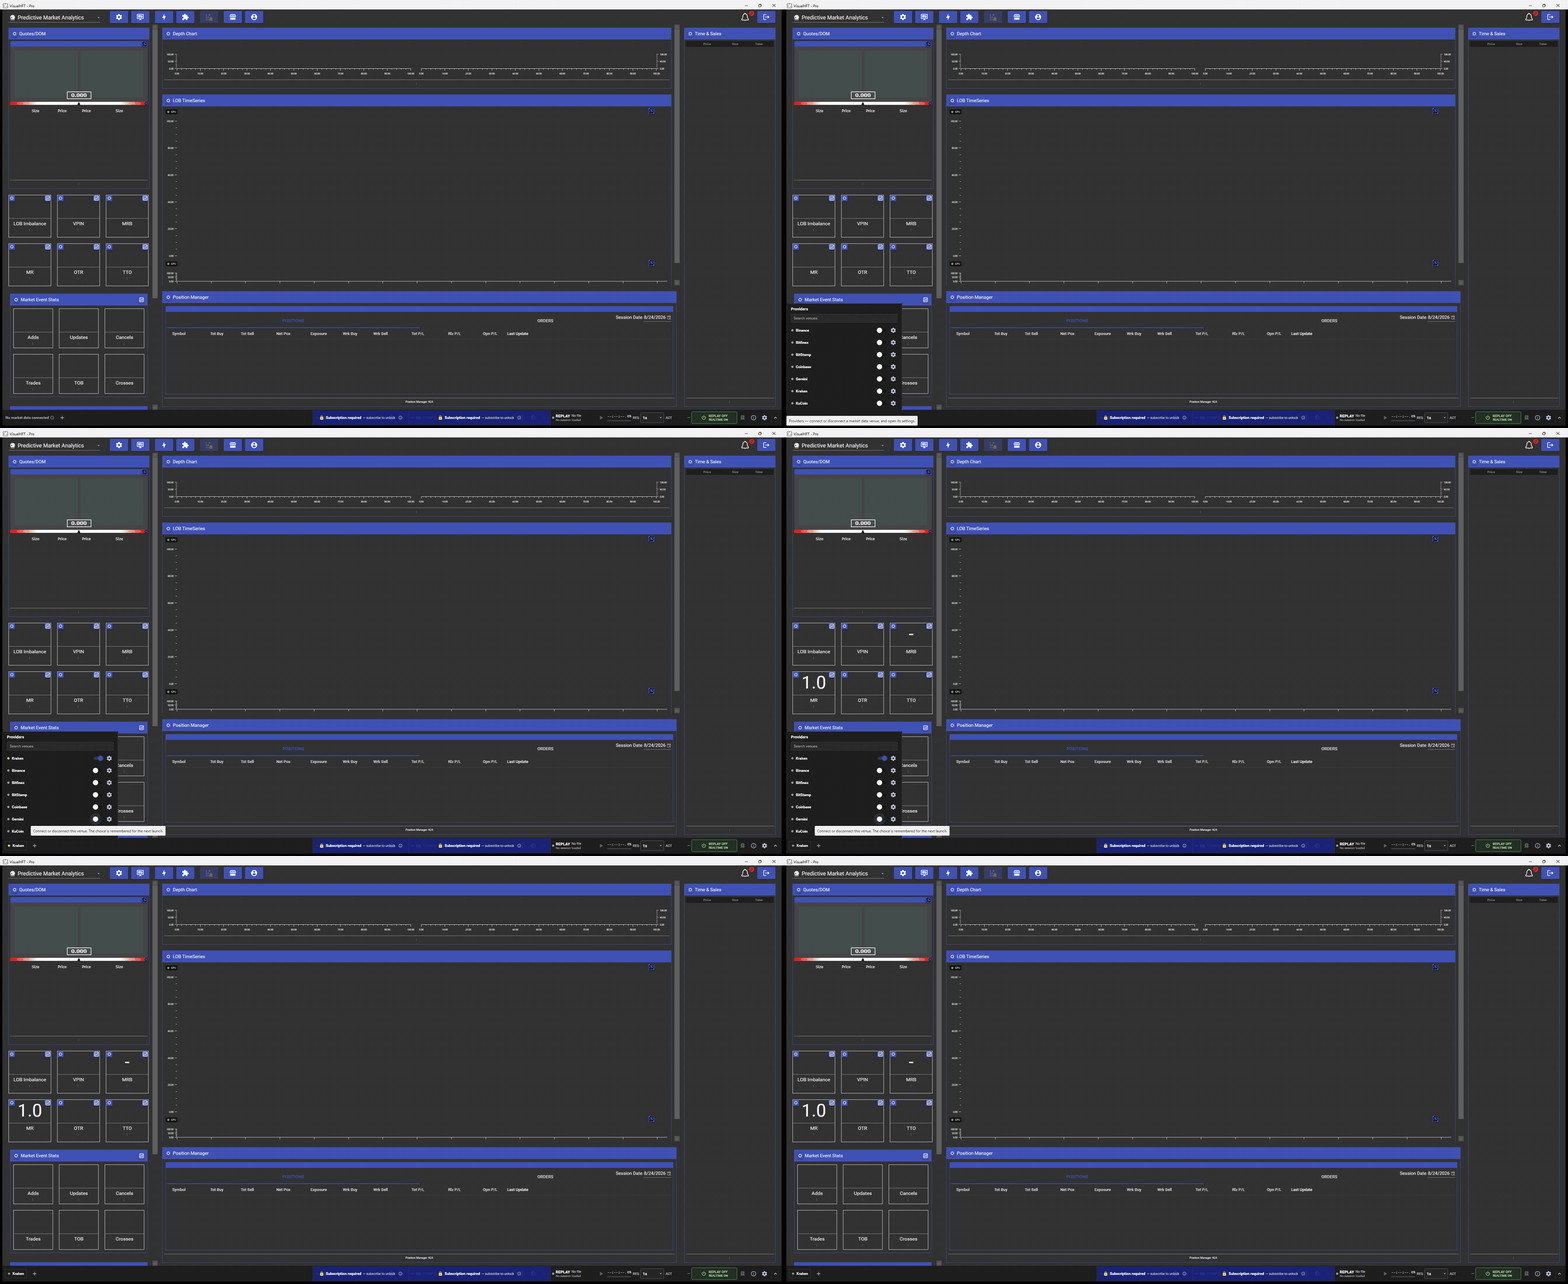
Flip the switch on one venue. Three things follow:
- the choice is written down before the socket is touched, so a connector that fails to come up is
still retried next launch (
ViewModel/vmProviderRail.cs:251); - the chip’s status dot turns amber and its tooltip reads
Connecting..., settling to the real state when the venue answers (ViewModel/vmProviderRail.cs:255,View/ucProviderRail.xaml:66-68); - the choice persists to
connector-connections.json, so the venue comes back automatically every time you start the application (Services/Providers/ConnectorConnectionStateStore.cs:44-47).
Start with one venue and one liquid instrument. A single venue keeps the picture clear while you learn the flow, and you can add the rest once data is arriving.
The seven connectors in the installer
All seven ship inside the installer and all seven are unlocked by the free Community plan
(VisualHFT.csproj:170-176). None of them needs an API key for public market data.
| Connector | Provider ID | Symbols it ships with | Order book depth |
|---|---|---|---|
| Binance | 1 | BTCUSDT(BTC/USD), ETHUSDT(ETH/USD) | 10 |
| Bitfinex | 2 | tBTCUSD(BTC/USD), tETHUSD(ETH/USD) | 25 |
| Kraken | 3 | BTC/USD, ETH/USD | 25 |
| KuCoin | 4 | BTC-USDT(BTC/USD) | 25 |
| Gemini | 5 | BTCUSD(BTC/USD), ETHUSD(ETH/USD) | 20 (fixed) |
| BitStamp | 6 | btcusd(BTC/USD), ethusd(ETH/USD) | 10 |
| Coinbase | 7 | BTC-USD(BTC/USD), ETH-USD(ETH/USD) | 25 |
Defaults read from each connector’s own source: BinancePlugin.cs:899-912,
BitfinexPlugin.cs:778-789, KrakenPlugin.cs:933-944, KuCoinPlugin.cs:1101-1112,
GeminiPlugin.cs:856-870, BitStampPlugin.cs:488-501, CoinbasePlugin.cs:828-839.
Because every connector already ships with a working Bitcoin and Ether subscription, connecting one venue is genuinely all you have to do to get data flowing. You only open the connector’s own settings when you want a different instrument.
Step 2: the connector’s own settings
The gear on a catalog row opens that connector’s settings. The dialog differs a little per venue, but the shape is always the same: Provider ID, Provider Name, API Key, API Secret, Symbols, and usually Depth Levels, then a red validation line with OK and Cancel.
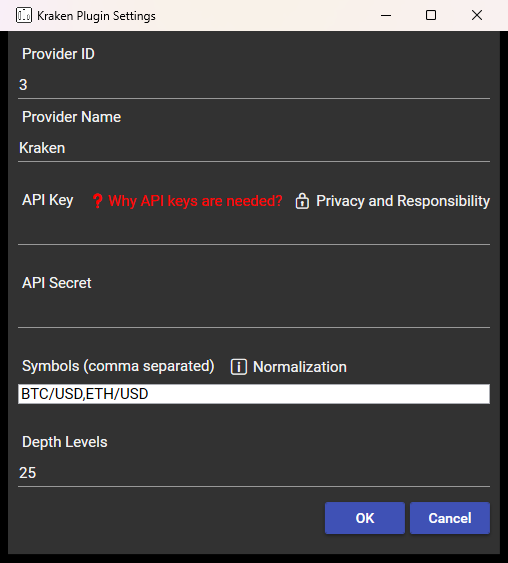
The symbol box is the part worth reading carefully
The label says Symbols (comma separated), and the syntax has two halves:
VENUE_SYMBOL(NAME_SHOWN_IN_THE_APP), VENUE_SYMBOL(NAME_SHOWN_IN_THE_APP)Everything to the left of the parenthesis is what VisualHFT subscribes to at the venue. Whatever is
inside the parenthesis is the name the rest of the application uses. Omit the parentheses and the same
string is used for both (VisualHFT.Commons/PluginManager/BasePluginDataRetriever.cs:540-554).
So BTCUSDT(BTC/USD) on Binance and tBTCUSD(BTC/USD) on Bitfinex both arrive as BTC/USD, which is
what makes the same instrument comparable across venues. Kraken is the one connector whose defaults
carry no parentheses, because Kraken’s own symbol for the pair is already BTC/USD.
Binance: set your region
Binance’s dialog carries an Is Non US location? checkbox. It ships unchecked, which routes to the US
venue (BinancePlugin.cs:222-225). If you are trading outside the United States, tick it so Binance
connects to the global venue.
API keys
No connector needs an API key or a secret for public market data. All seven ship with both fields
blank, and the credential object is simply never attached when they are empty (Binance
BinancePlugin.cs:220-221, Kraken KrakenPlugin.cs:101-103). Supplying keys adds your own private
order stream. Three surfaces need it and nothing else does: the Exec Lat metric, the Position
Manager tile (ViewModel/vmPosition.cs:112) and Microstructure Diagnostics.
The dialog’s own note is accurate: keys are stored locally on your own machine and sent to nobody. Use a key scoped to market data only. That is all any connector on this page needs, and it keeps a trading-enabled key out of a workflow that never requires one.
What OK does
OK saves, reparses the symbol list, and then restarts the connector
(BinancePlugin.cs:934-940). The restart goes through the same exponential backoff the reconnection
logic uses, so the first attempt waits about two seconds and each further attempt doubles, with up to
five attempts (BasePluginDataRetriever.cs:344, :21). A connector that does not come straight back
after you press OK is normal for a few seconds. Cancel discards your edits.
Step 3: point each tile at a provider and a symbol
This is the step that brings the dashboard to life, so it is worth understanding the mechanism.
A study receives every order book update the application publishes, and the first thing it does is throw away anything that does not match its own configured provider and symbol:
if (_settings.Provider.ProviderID != e.ProviderID || _settings.Symbol != e.Symbol)
    return;
That is Studies.LOBImbalance/LOBImbalanceStudy.cs:85-86. The study ships configured with
Symbol = "" and an empty provider (Studies.LOBImbalance/LOBImbalanceStudy.cs:159-168), and an
empty setting matches nothing, so a market-data tile produces its first value as soon as you give it
a provider and a symbol.
Every tile on the default dashboard discards non-matching data this way, but they do not all filter on the same thing, which matters once you have more than one venue connected:
| Study | Filters on |
|---|---|
| LOB Imbalance, VPIN, Market Resilience, Market Ratios, Market Event Stats, order and trade ratios | Provider and symbol |
| Depth Chart, Quotes and Level 2 DOM, LOB TimeSeries | Provider and symbol, checked in their view models (Studies.DepthChart/ViewModels/vmDepthChart.cs:228-230, Studies.QuoteLevel2DOM/ViewModels/vmQuoteLevel2DOM.cs:187-189) |
| Time and Sales | Provider only (Studies.TimeAndSales/ViewModels/vmTimeAndSales.cs:137) |
| Market Latencies Stats, Market Operational Ratios | Provider only. Their settings dialogs have no symbol field at all |
A study that filters on provider only still shows nothing until you have chosen a provider, so the step is the same either way. The difference is that its numbers cover every instrument on that venue, not the one you picked.
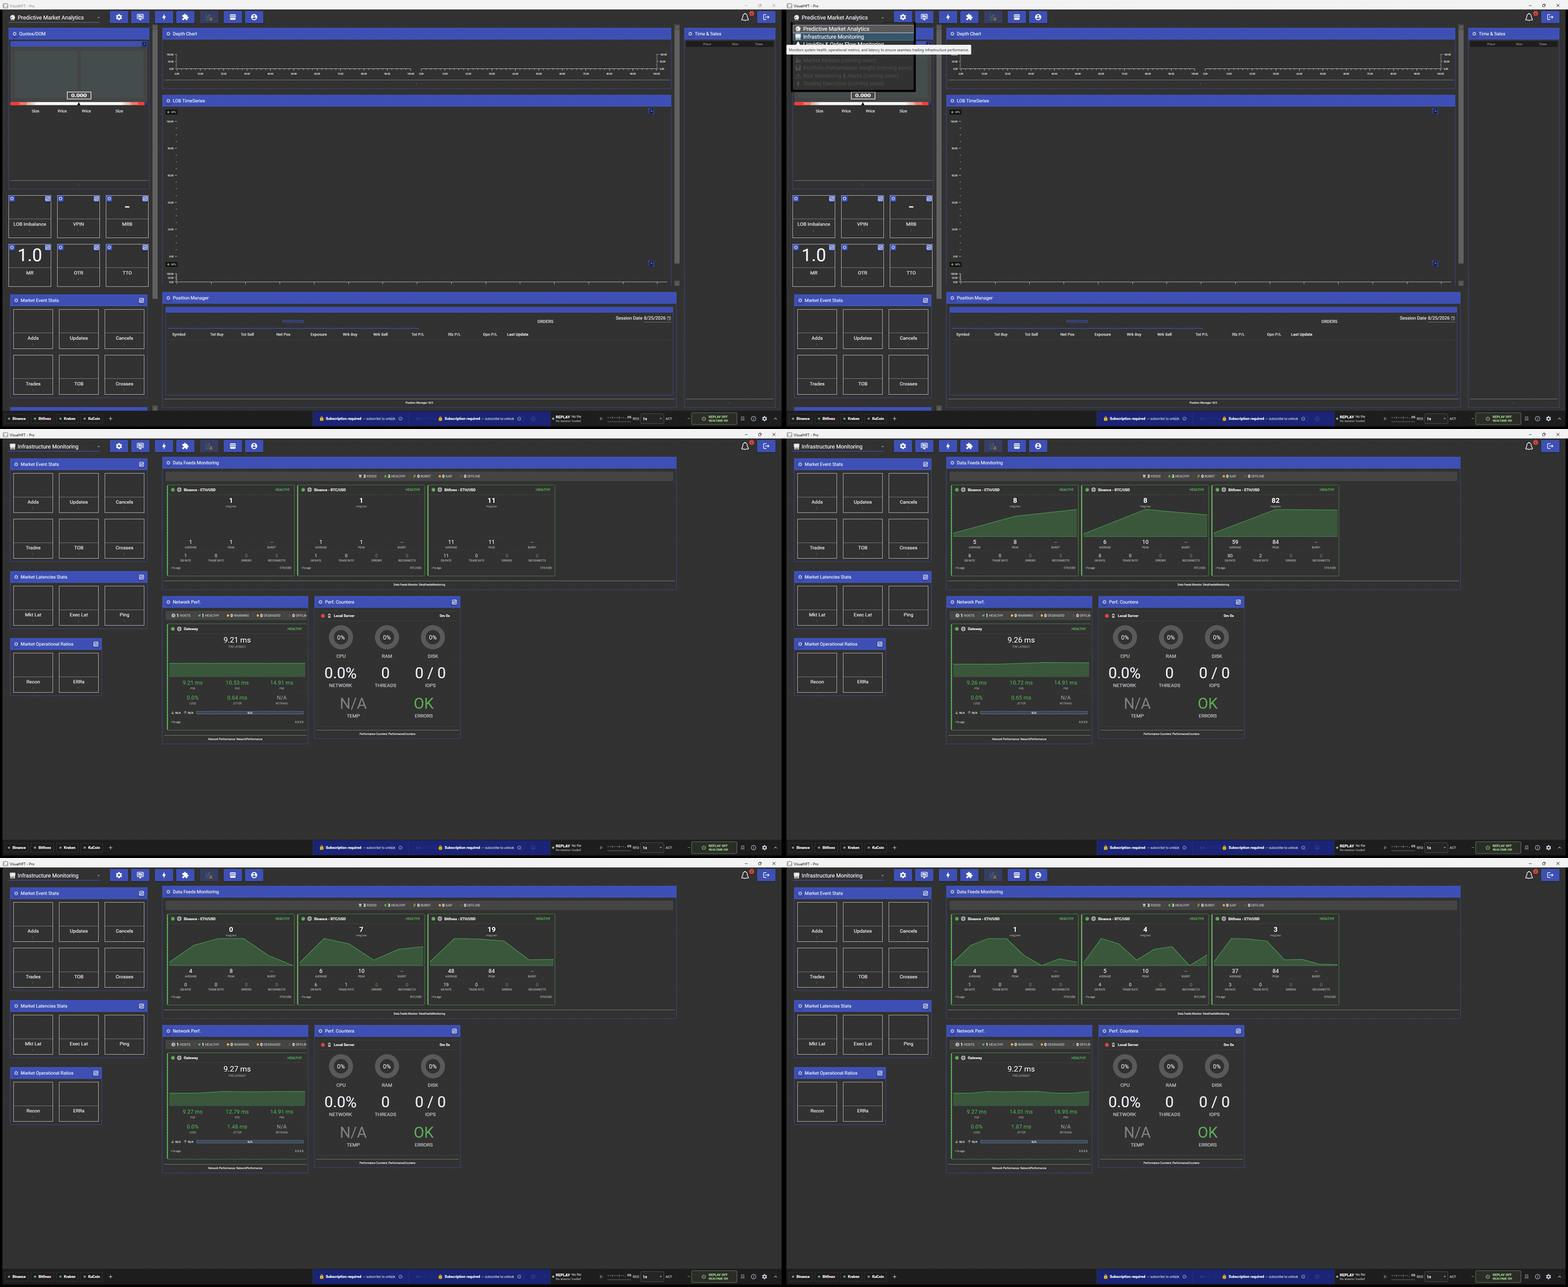
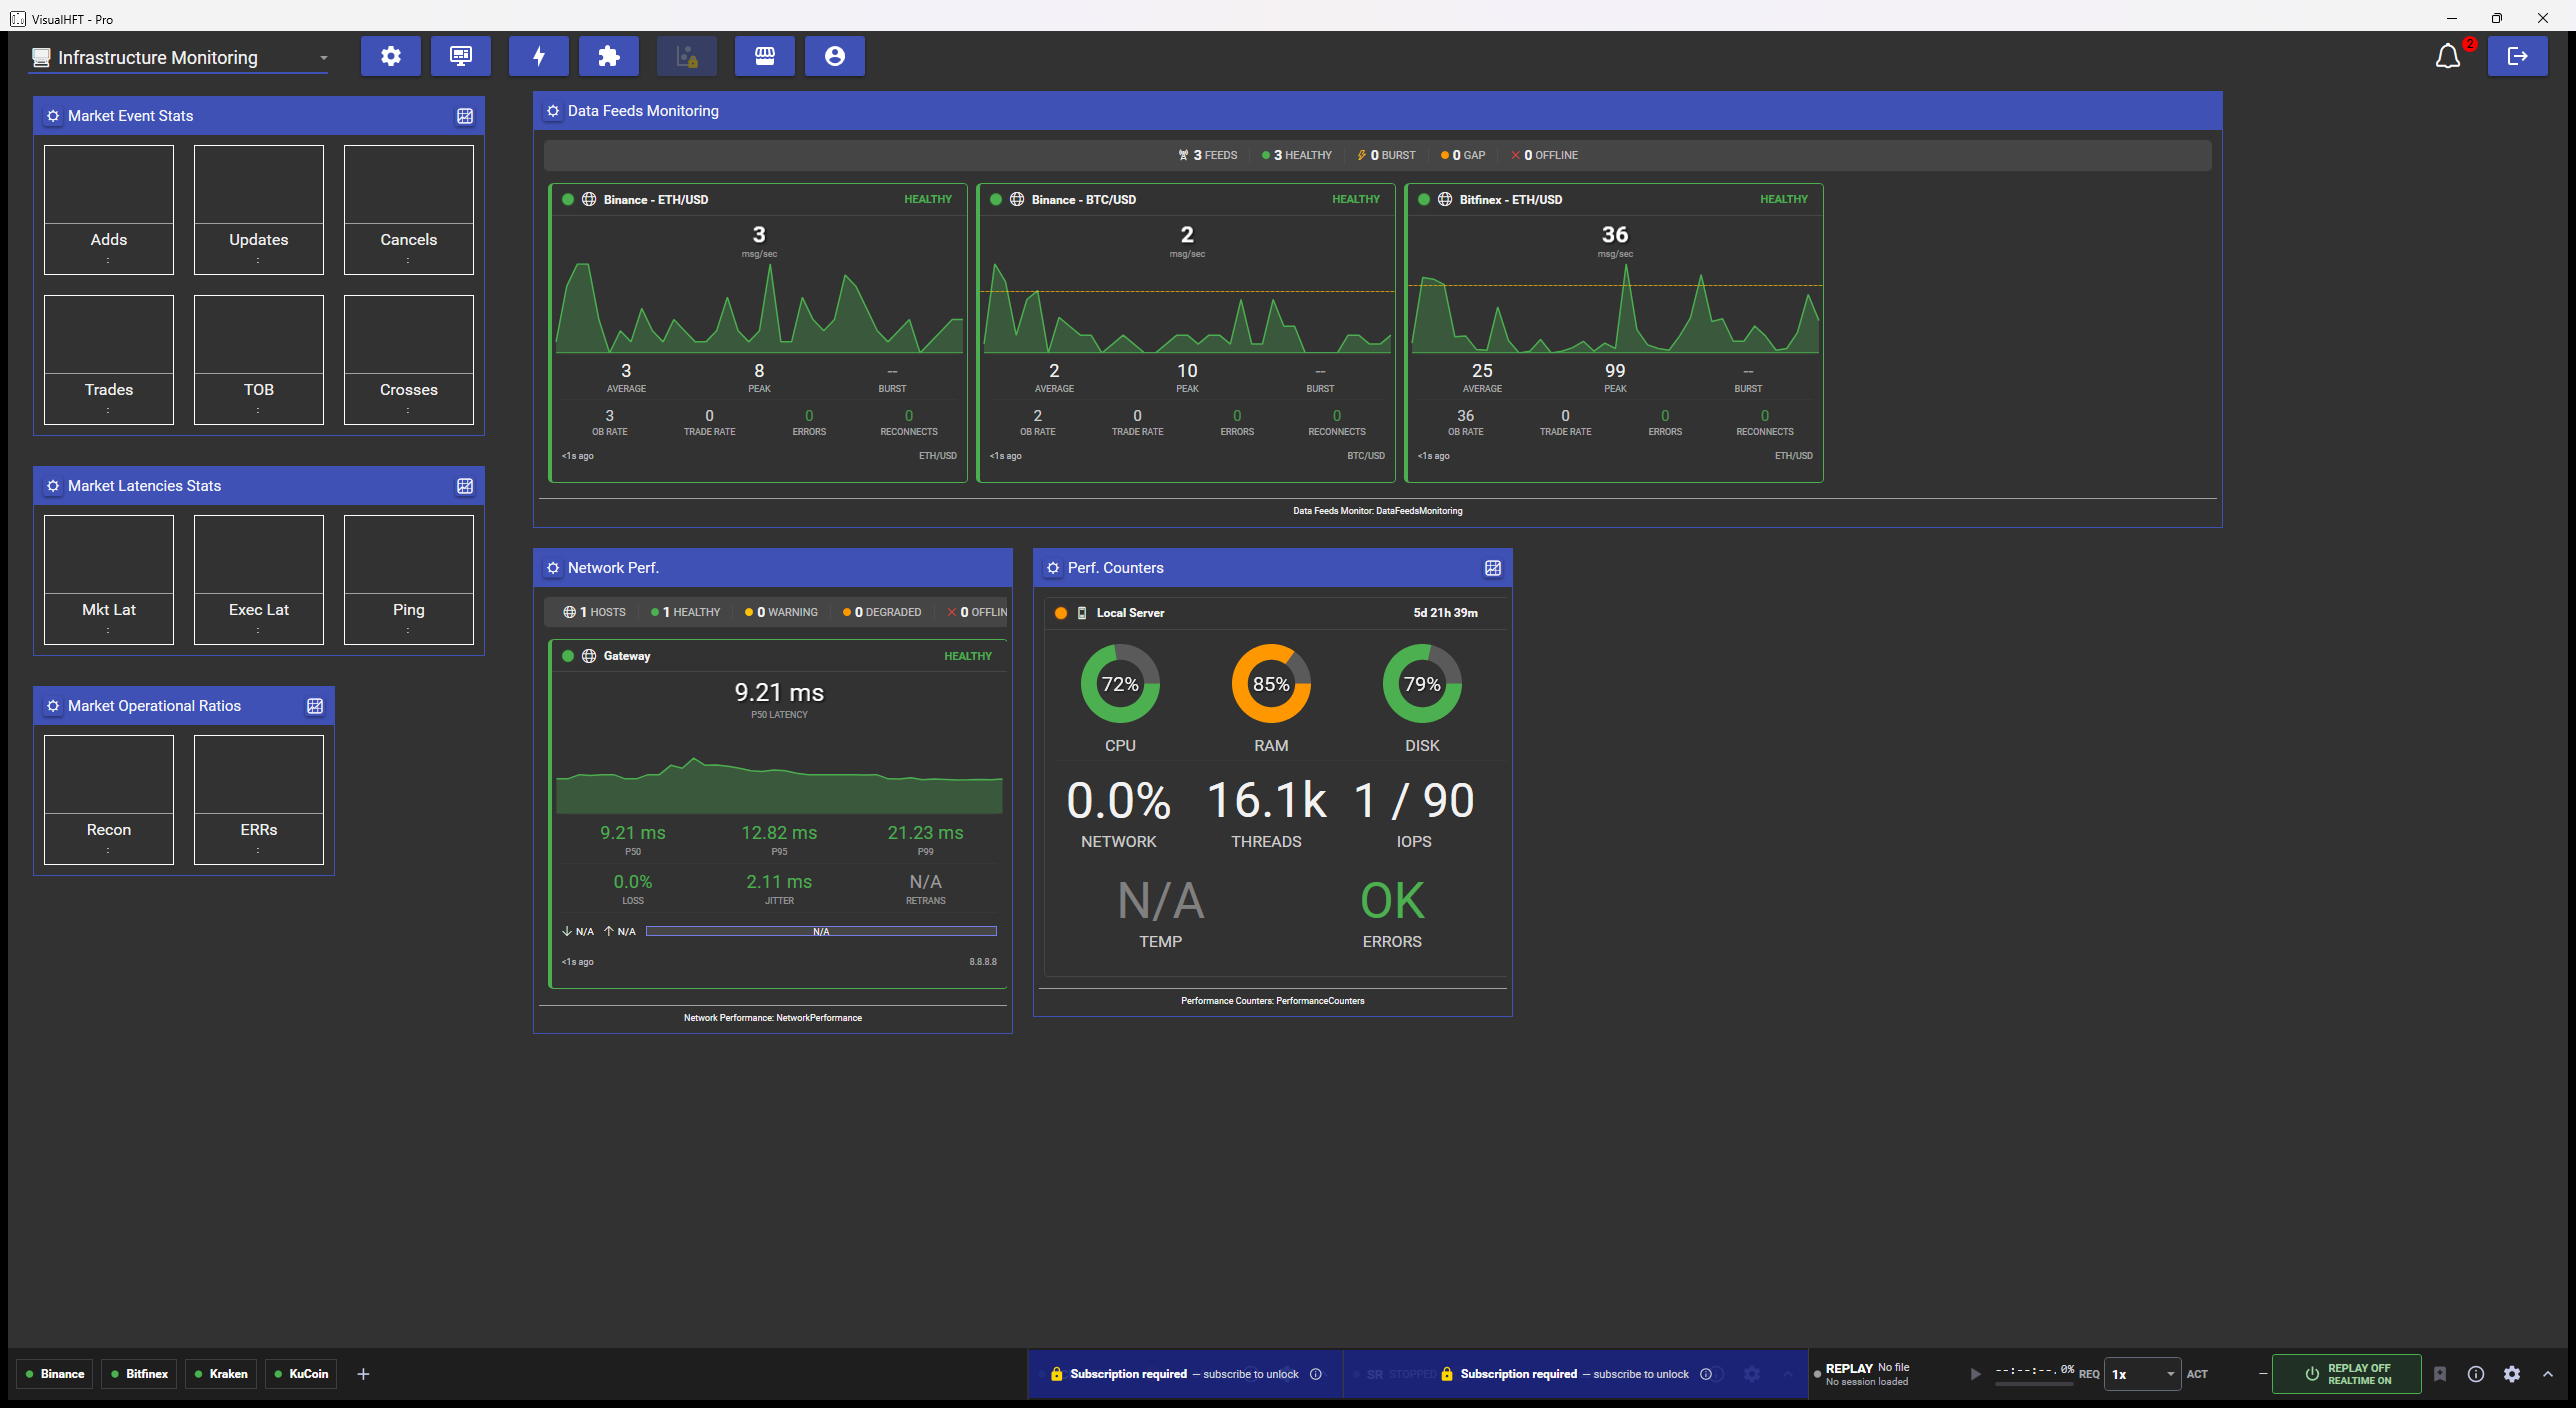
Three studies are the exception and need no configuration at all. Performance Counters ships
watching localhost, Network Performance ships pinging 8.8.8.8, and Data Feeds Monitoring adopts
up to three live venue and symbol pairs the first time it starts
(Studies.PerformanceCounters/PerformanceCountersPlugin.cs:136-143,
Studies.NetworkPerformance/NetworkPerformancePlugin.cs:141-148,
Studies.DataFeedsMonitoring/DataFeedsMonitoringPlugin.cs:97-118). All three live on the
Infrastructure Monitoring dashboard, which is why parts of that dashboard are alive before you touch
anything.
Here is what that looks like. The three counter groups on the left have no provider selected and show labelled but empty boxes, while the panels that configure themselves are already live:
The dialog
Click the gear in a tile’s top left corner, or, on a counter group, the gear in the group’s header,
which configures every counter in that group at once. The market-data studies offer the same three
fields, then OK and Cancel (Studies.LOBImbalance/UserControls/PluginSettingsView.xaml:10-34).
Three exceptions are worth knowing: Market Latencies Stats and Market Operational Ratios ship without
a Symbol field because they report on the venue rather than on an instrument, and Position Manager has
no settings dialog at all (Studies.Positions/PositionsPlugin.cs:102-105).
| Field | What it does |
|---|---|
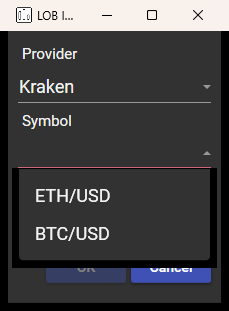
| Provider | Which connected venue this tile watches. The list holds every connector that has registered, and it opens on the first venue that is already connected (Studies.LOBImbalance/ViewModel/PluginSettingsViewModel.cs:186-187) |
| Symbol | Which instrument, by its normalised name |
| Aggregation | How often the tile recomputes: No Aggregation, 1, 10, 100 or 500 milliseconds, 1, 3 or 5 seconds, or Daily (VisualHFT.Commons/Model/enums.cs:86-108) |
Two things about Aggregation that the dropdown does not tell you:
- The three finest settings are Pro only. On Community and Core, No Aggregation, 1 millisecond
and 10 milliseconds are shown locked, and a study asking for one of them runs at the 100 millisecond
floor instead (
Services/Entitlement/EntitlementService.cs:37-41,:58-68, applied on every study start atVisualHFT.Commons/PluginManager/BasePluginStudy.cs:106). - Defaults vary by study, and one study ignores the field. Most order-book studies ship at 100
milliseconds, Market Resilience at 500 milliseconds, the ratio tiles at 1 second, Position Manager
at no aggregation. VPIN runs on a fixed 1 second cadence (
Studies.VPIN/VPINStudy.cs:393).
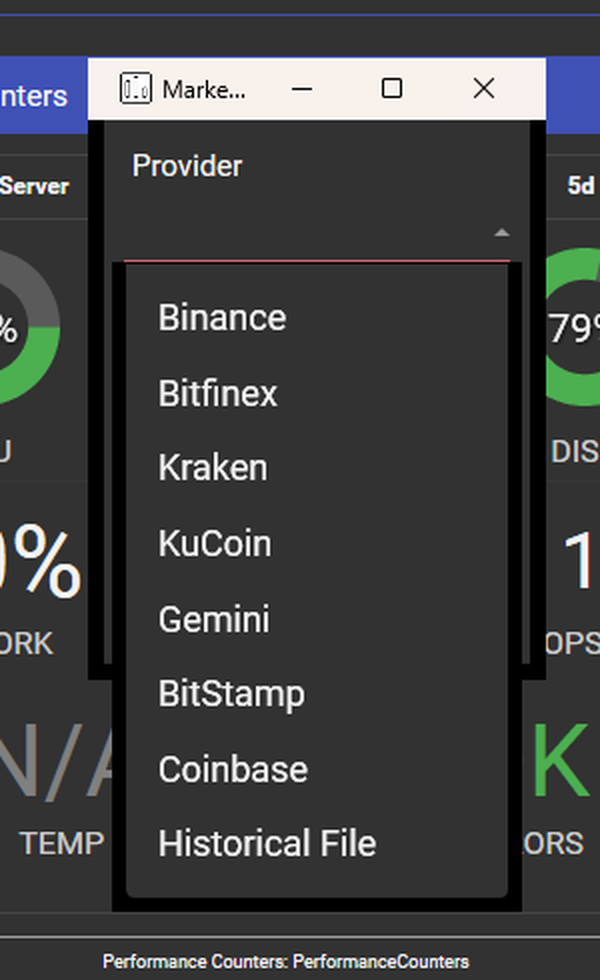
On the Pro plan the provider list also includes Historical File, which is the Replay Engine, so
the same tiles work identically over a replayed capture. That is why the animation at the top of this
page reads Historical File in every tile footer. Below Pro the Replay Engine is not loaded at all
and that entry is absent (PluginManager/PluginManager.cs:771-772).
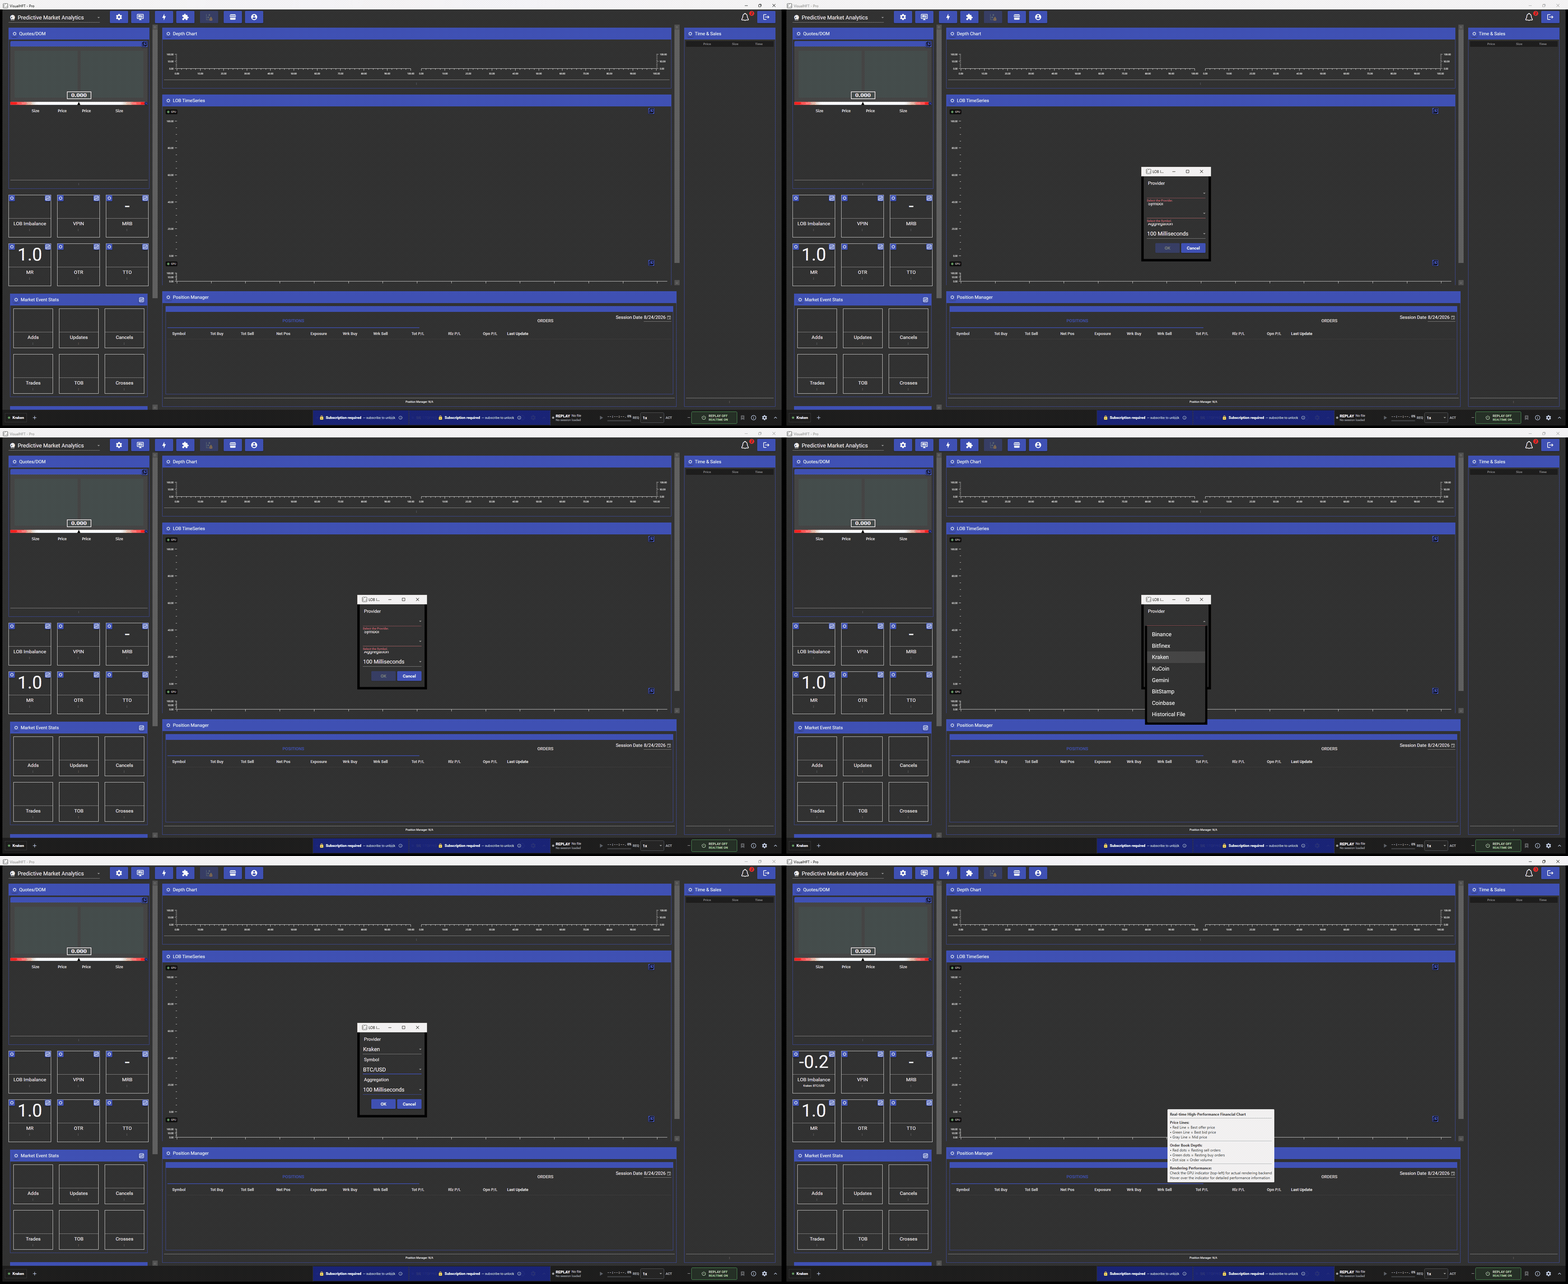
Two behaviours to expect
OK stays disabled until both Provider and Symbol are set
(Studies.LOBImbalance/ViewModel/PluginSettingsViewModel.cs:149-155). The field you have not filled
in is outlined in red, so the outline tells you which field OK is still waiting on.
The Symbol list is empty until a venue has actually delivered a book. The list is not a catalog of
tradable instruments. It is the running set of symbols the application has already seen, appended to
as data arrives (VisualHFT.Commons/Helpers/HelperSymbol.cs:12-18, fed from
BasePluginDataRetriever.cs:105). If you open a tile’s settings within a second or two of connecting
a venue, the Symbol box will be empty. Wait for the chip in the footer to go green and try again.
Pressing OK restarts that study. The tile clears and repopulates from the next matching update.
Repeat for each tile you care about, and the column comes alive:
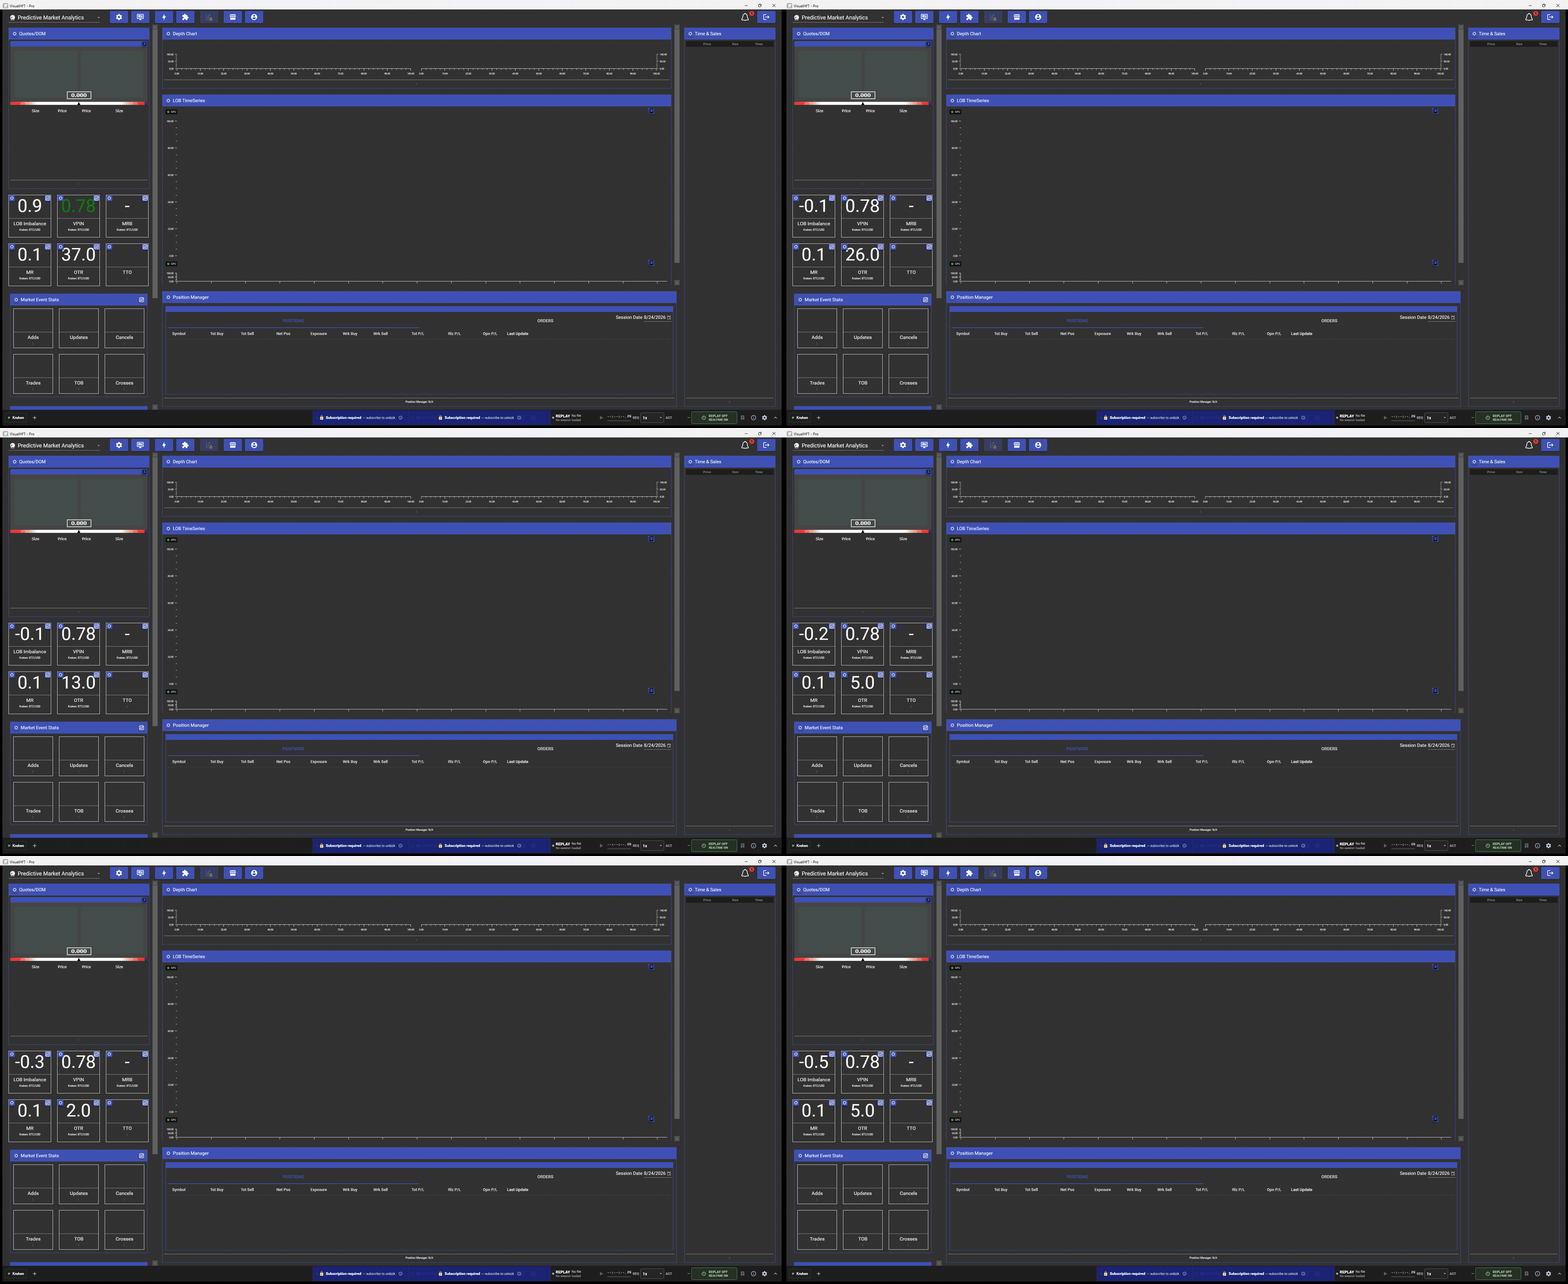
Look at the TTO tile in that clip. It was left unconfigured on purpose so you can see the difference side by side: the tiles carrying a provider and a symbol update, and the one still waiting for its two fields keeps an empty footer. Set those two fields and it joins the others.
The dashboards
The picker in the top left holds three working dashboards and five marked “coming soon”, which are
visible but not selectable (DashboardManager/DashboardManager.cs:245-269). The application opens on
the first one that can load, which is Predictive Market Analytics.
| Dashboard | What it is for |
|---|---|
| Predictive Market Analytics | The default. A quote ladder and level 2 depth, then order book imbalance, VPIN, market resilience and the order and trade ratio tiles, with a depth chart, a limit order book time series, position manager and time and sales |
| Infrastructure Monitoring | Feed health, network path quality, host counters, and per venue latency, error and event rate counters. Covered in its own guide |
| Liquidity and Order Flow Monitoring | The liquidity and flow subset, plus the two analytics launchers |
Two things to know about switching:
- Each dashboard has a fixed layout. Each dashboard’s slots are declared in code
(
DashboardManager/DashboardManager.cs:152-223). You cannot drag a tile to a different position or add one that is not in the layout. - Switching stops the outgoing dashboard’s studies. Every tile’s study is stopped as its dashboard
is torn down (
ViewModel/vmDashboardL3.cs:571,ViewModel/vmTile.cs:496-516). Your provider and symbol settings are saved and will still be there when you come back, but each tile starts empty again and refills from the next update.
You do not start studies yourself. A study starts automatically when its tile is built
(ViewModel/vmDashboardL3.cs:486-487). Connectors are the only thing you switch on by hand.
What is included, and what is a separate purchase
Two independent things decide whether a plugin works for you: the plan you are on, and, for the six paid add-ons only, whether you own that add-on.
Plans
| Plan | Price | What it adds |
|---|---|---|
| Community | Free | All seven venue connectors, plus VPIN, order book imbalance, the limit order book time series, the depth chart, position manager, quotes and level 2 depth, time and sales, order to trade ratio, market resilience and market resilience bias |
| Core (L2) | $129 per month, $1,290 per year, 7 day trial | Everything in Community, plus market ratios, trade to order ratio, market event statistics, market latency statistics, operational ratios, performance counters, data feed monitoring and network performance |
| Pro | $799 per month, $7,990 per year, 7 day trial | Everything in Core, plus the Replay Engine at no extra cost, sub-100-millisecond aggregation, and access to buy the Pro add-ons |
| Enterprise | Contact sales | Everything in Pro, plus custom feeds, single sign-on and a private marketplace |
Plan rows and prices from scripts/seed-marketplace.js:1463-1548. Core (L2) is the name shown in
the Marketplace, not Core. Each plugin declares its own plan floor in its source, and anything that
declares nothing is Community (VisualHFT.Commons/PluginManager/BasePluginStudy.cs:60).
The six add-ons that are bought separately
These are the only plugins that are a purchase rather than a plan inclusion. None of them is in the
installer. They are delivered to your machine after purchase, so before you own one it is not
present on disk at all (VisualHFT.csproj:142-168).
| Add-on | Plan floor | Price | What it is |
|---|---|---|---|
| Cross-Venue Analytics | Core | $49 per month | Compares the same instrument across every connected venue |
| Market Aggregator | Core | $49 per month | A connector that consolidates several venues into one book |
| Liquidity Analytics | Core | $149 per month | Depth profile, cost of immediacy, replenishment |
| Session Recorder | Pro | $249 per month | Records a session for later replay |
| Event Capture Recorder | Pro | $249 per month | Captures a defined event window |
| Microstructure Diagnostics | Pro | $799 per month | The microstructure diagnostics launcher |
Catalog rows from scripts/seed-marketplace.js, entries at :54, :65, :329, :418, :443,
:454.
The Replay Engine is the exception worth knowing. It is bundled in the installer and it is not a
purchase, but its plan floor is Pro, so it is present but unavailable below that plan
(scripts/seed-marketplace.js:432-442, VisualHFT.csproj:196).
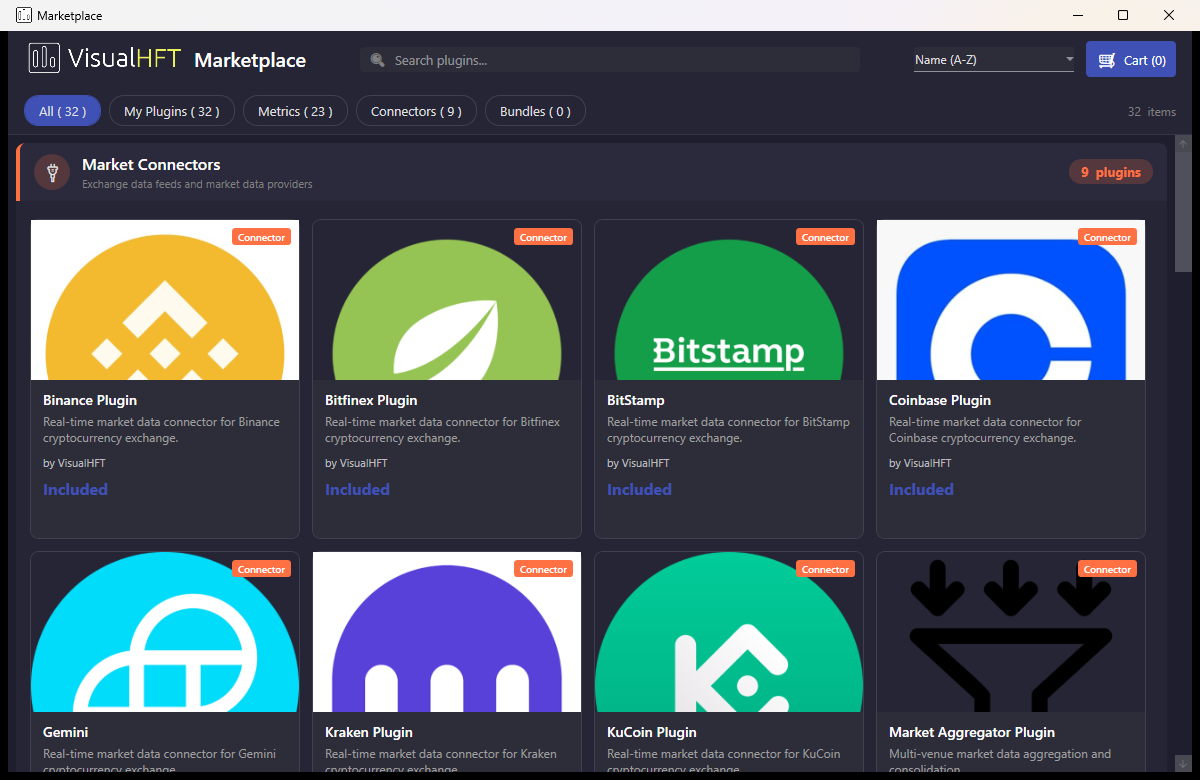
In the Marketplace, reached from the storefront icon in the top bar, a plugin included with your
plan is labelled Included where a price would be, and a paid add-on you own carries a green
Purchased badge (View/MarketPlace/MarketPlaceListing.xaml:244).
Plugins Management, when a tile is not the right surface
The jigsaw icon in the top bar opens Plugin Manager: every loaded plugin grouped by type, with its
version, description and status, and buttons to start, stop and configure it
(View/PluginManagerWindow.xaml:25-88).
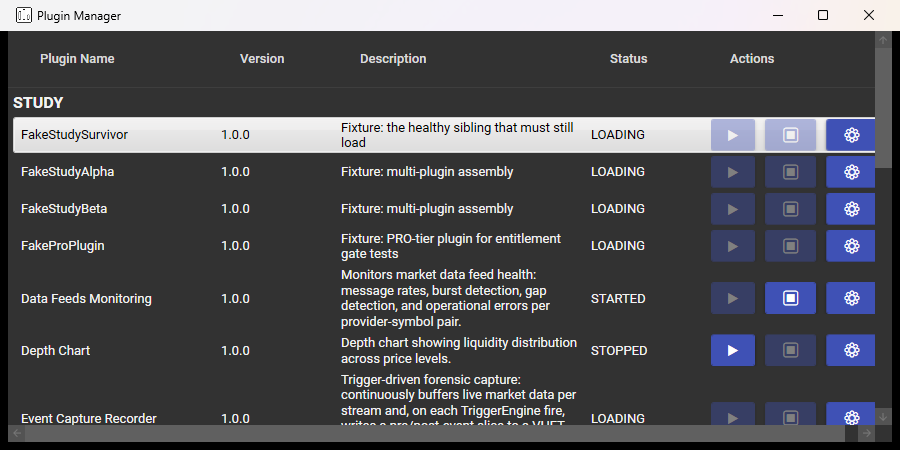
The Status column shows the raw internal state. There are eight of them: LOADING, LOADED,
STARTING, STARTED, STOPPED, STOPPED_FAILED, MALFUNCTIONING and STOPPING
(VisualHFT.Commons/UserSettings/enums.cs:17-27). One caution:
STARTEDmeans the plugin loaded and its wiring completed. Give a study its provider and symbol and it begins producing on the next matching update.
The list refreshes on a ten second timer rather than when something changes
(ViewModel/vmPluginManager.cs:21), so give it a moment after starting or stopping something.
Checklist: bringing every tile live
Work down this list. It is ordered by how often each one is the answer.
| Check | What a live tile looks like | What to do otherwise |
|---|---|---|
| The tile’s own footer line | Kraken: BTC/USD, naming a venue you are connected to | Blank or a different venue. Open the gear and set both fields |
| The footer chip for that venue | Present and green | No chip means not connected. Open the + catalog and switch it on |
| The Symbol you chose | Matches the name inside the parentheses in the connector’s symbol box | A tile set to BTC/USD will never match a connector publishing BTCUSDT |
Time elapsed since OK | A few seconds for most tiles | Some studies need a warm up window or a minimum number of trades before their first value |
| The notification bell | No repeating error | Repeated parse or socket errors point at the connector, not the tile |
| Plugin Manager status | STARTED | STOPPED_FAILED means the connector exhausted its five reconnection attempts |
Where your settings live
Everything you configure on this page, including connector API keys, is in a single file:
%LOCALAPPDATA%\VisualHFT.UserData\Settings\settings.jsonWhich connectors you left switched on is kept separately, beside it:
%LOCALAPPDATA%\VisualHFT.UserData\Settings\connector-connections.jsonVisualHFT rewrites the whole settings file whenever you press OK in any settings dialog, taking a
timestamped copy of it first (VisualHFT.Commons/UserSettings/SettingsManager.cs:146-151). Those
copies are stamped to the minute, so two saves in the same minute share one backup, and anything
older than 60 days is pruned (:159-188).
Where to go next
- Monitor your trading infrastructure for feed health, network path quality and alerting on any of it.
- Use your own historical market data for recording a session and replaying it through the same tiles.
- Troubleshoot VisualHFT when a connector will not stay up.