Install VisualHFT Terminal and verify first launch
Create your account, download and verify the signed Windows installer, sign in, start your plan, and establish a clean Dashboard baseline.
Task-oriented guidance for installing, configuring, operating, extending, and diagnosing VisualHFT Terminal, with product and open-source guides kept clearly separated.
Document library · filterable
Search the field manual or narrow it by edition and topic.
17 documents
Create your account, download and verify the signed Windows installer, sign in, start your plan, and establish a clean Dashboard baseline.
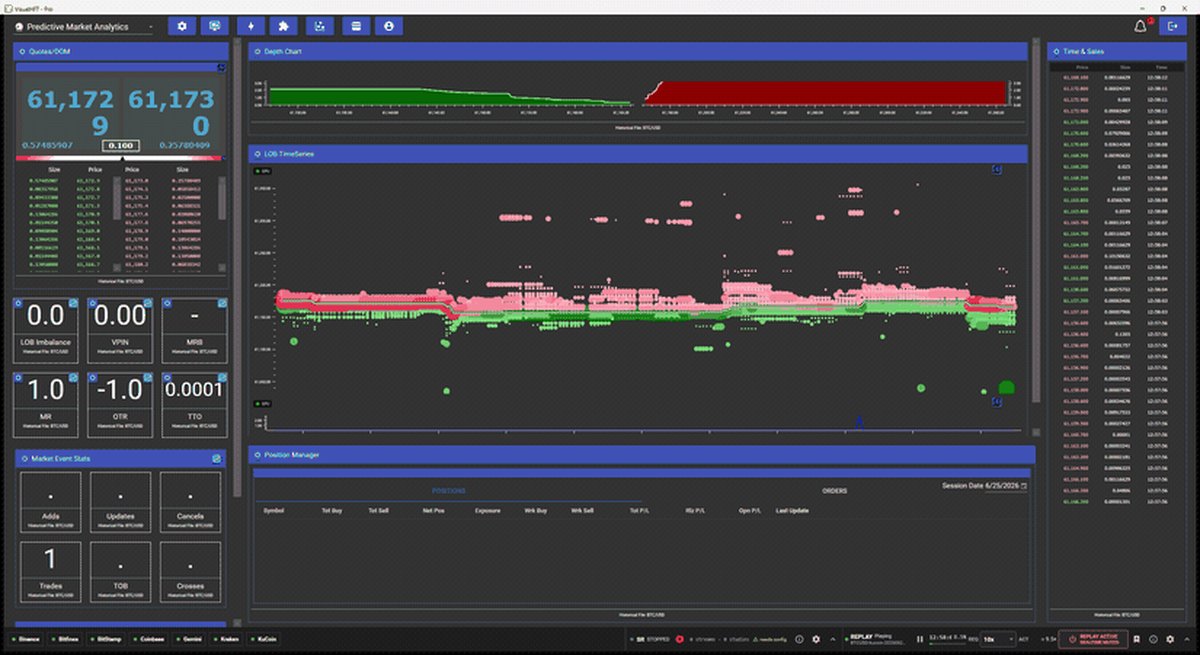
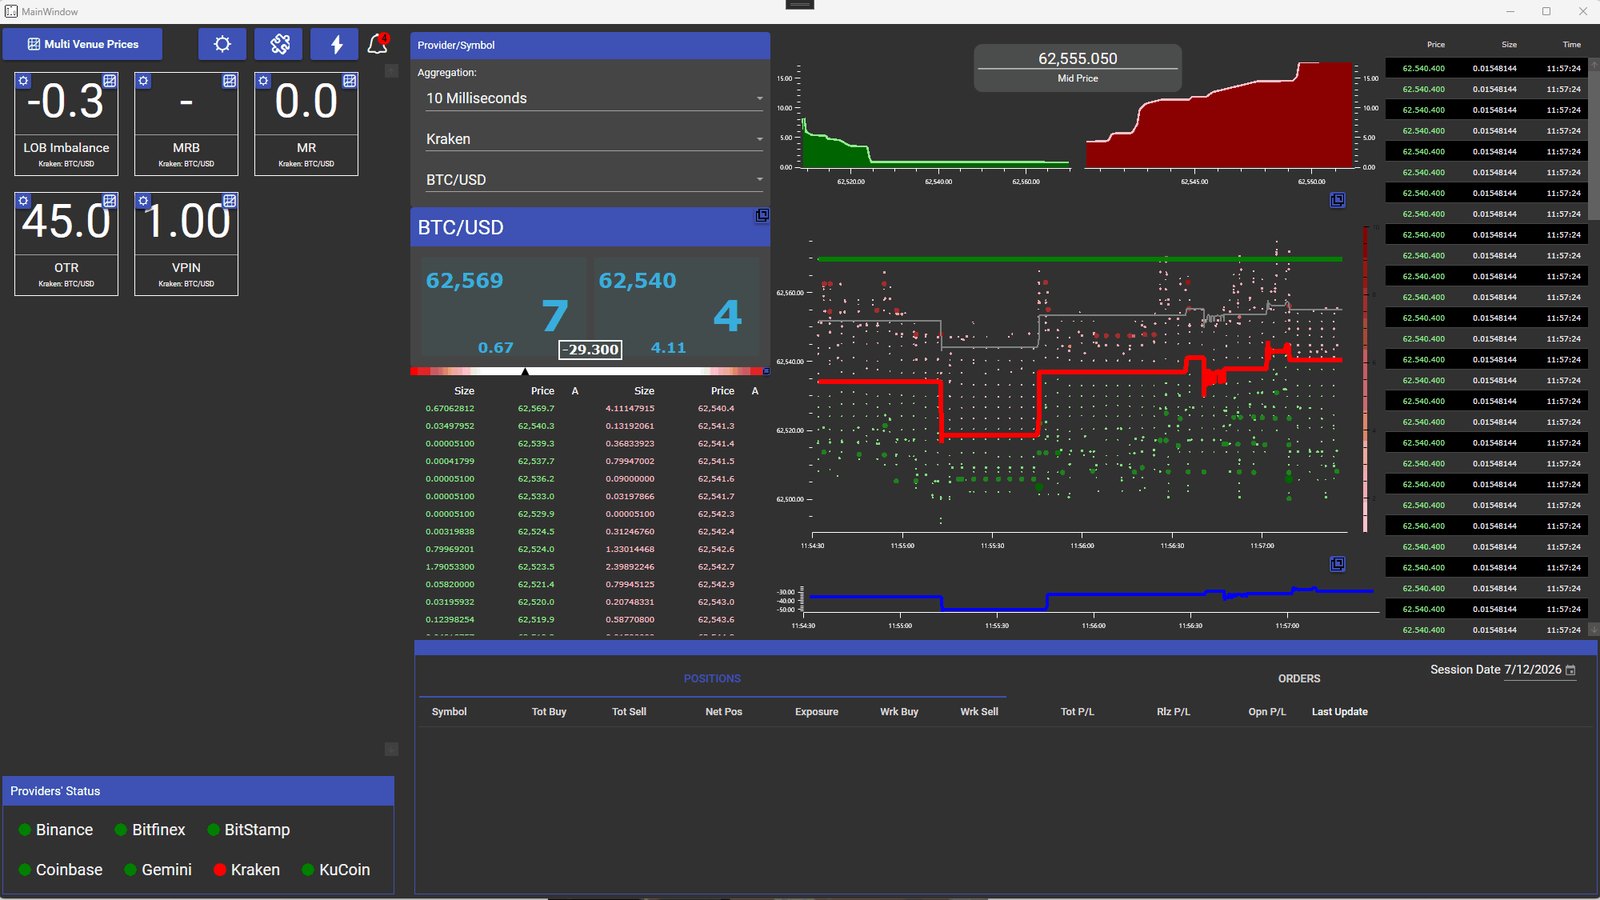
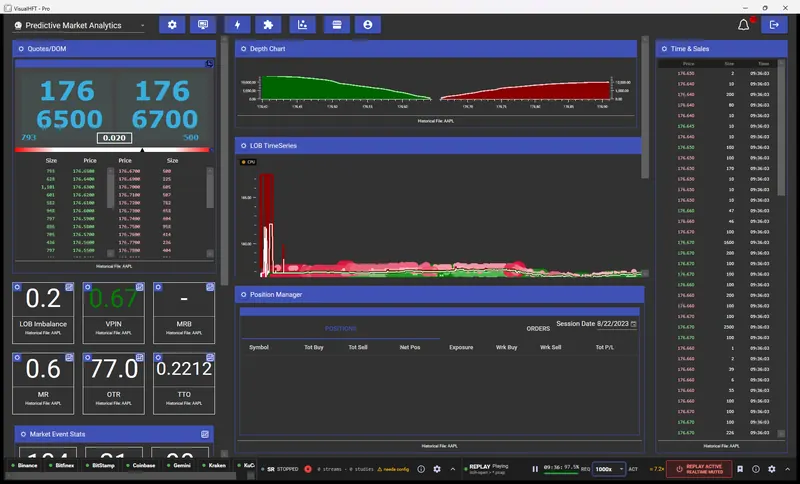
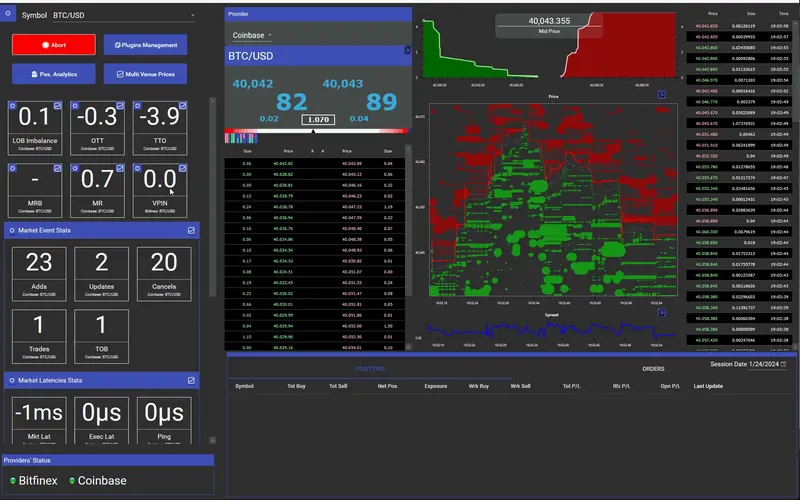
Open guide → What to do in the first ten minutes after installing VisualHFT Terminal. How the dashboard is built, how to connect a market connector, how to point each tile at a provider and a symbol, and which plugins are included versus bought separately.
Open guide → Step-by-step guide to clone the VisualHFT and OxyPlot repositories, build the C# solution in Visual Studio or dotnet CLI, and launch the Dashboard.
Build the public application, connect market data, inspect its built-in studies, and follow the current extension templates.
Open guide → Configure a connector, select a venue and symbol, verify feed health, operate studies, and shut the system down cleanly.
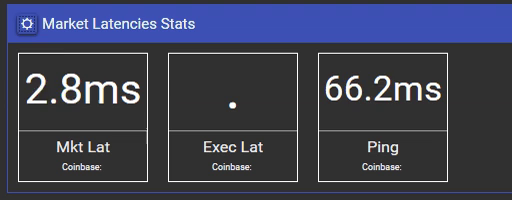
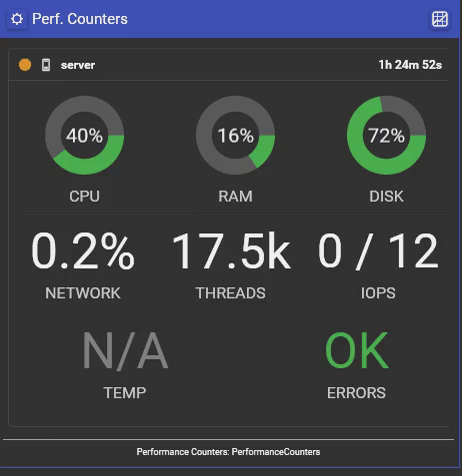
The Infrastructure Monitoring dashboard and the six shipping plugins behind it: feed health, network path quality, remote server counters, exchange latency, operational errors, and order-book event rates. Setup, what each number measures, and how to alert on it.
Open guide → Run controlled GPU, cross-venue, latency, and performance investigations without confusing a display change with a market-data result.
One Desk, one question: who is pressing the market right now, and how hard? What each constituent tile measures, what it reads from the feed, and how to read it on screen. Footprint and Smart Tape as context, and how to read the tiles together.
Install and diagnose Core and Pro plugins without confusing Marketplace delivery with the public source-build SDK workflow.
Create custom C# market connectors or quantitative studies from the VisualHFT SDK templates and configure runtime plugin discovery.
Trace the VisualHFT Terminal (Core and Pro) application from plugin delivery through connector, shared market-data, study, trigger, recorder, replay, and Dashboard boundaries.
Trace VisualHFT open-source market-data ingestion, lock-free order book pipelines, plugin lifecycle, study results, and dependency boundaries.
Record VisualHFT Terminal sessions, verify their stream metadata and finalization, then replay them with controlled routing and timing.
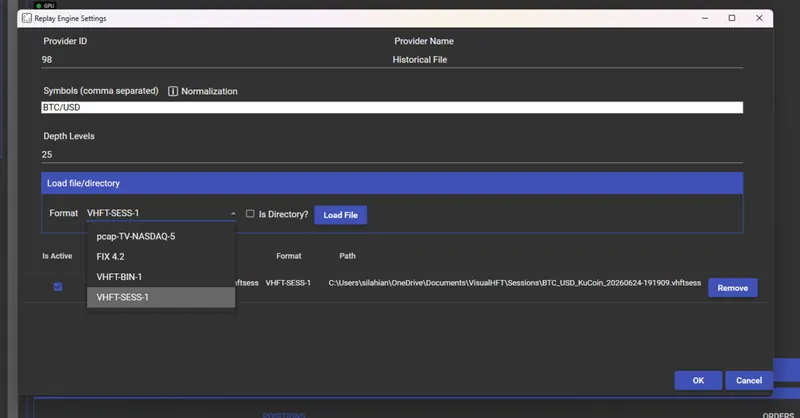
Feed captured market data into VisualHFT Terminal: the four formats the Replay Engine reads, loading a NASDAQ TotalView-ITCH pcap directory, recording your own sessions, writing a converter for any other source, and what the dashboard shows once the tape is playing.
Interpret common VisualHFT Terminal (Core and Pro) settings, lifecycle states, units, precision, and displayed market-microstructure metrics.
Open guide → Use a repeatable evidence-first workflow for startup, connector, data, plugin, rendering, and replay problems.
Diagnose and resolve missing OxyPlot sibling dependencies, undiscovered C# plugins, and market-data providers publishing no quotes.
Start with the outcome
Browse by topic
New to VisualHFT? Get Started. New accounts get a 7-day trial.
Two reading modes
Docs tell you what to do and what to verify. The Blog carries engineering stories, announcements, market-microstructure education, and the reasoning behind product decisions.