VisualHFT Documentation
Operator field manual

Build clarity into
every market event.

Task-oriented guidance for installing, configuring, operating, extending, and diagnosing VisualHFT Terminal, with product and open-source guides kept clearly separated.

Document library · filterable

Find guidance by edition or subject.

Search the field manual or narrow it by edition and topic.

Type to search the field manual

VisualHFT technical documentation Enter to open
Topics 56+

16 documents

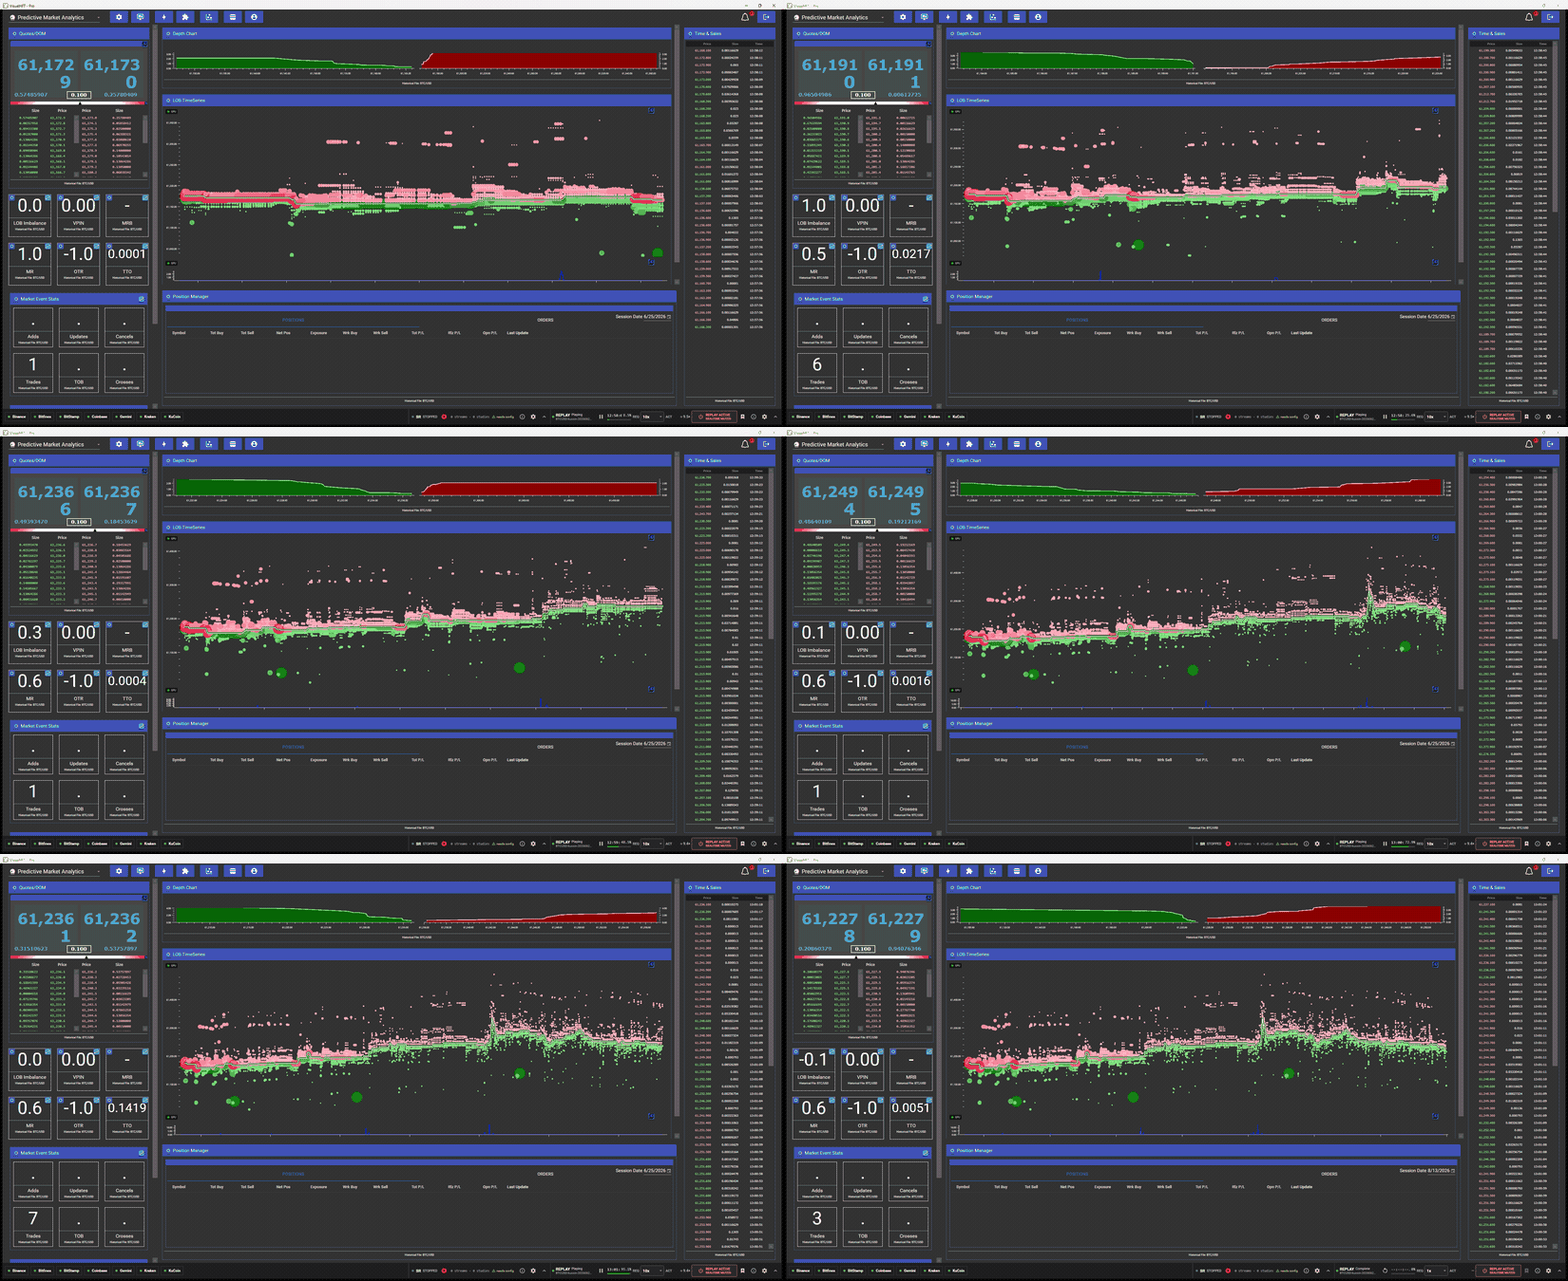
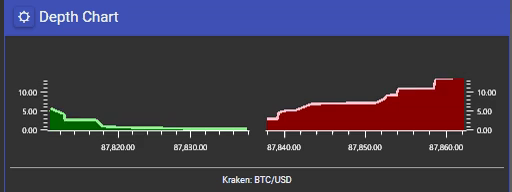
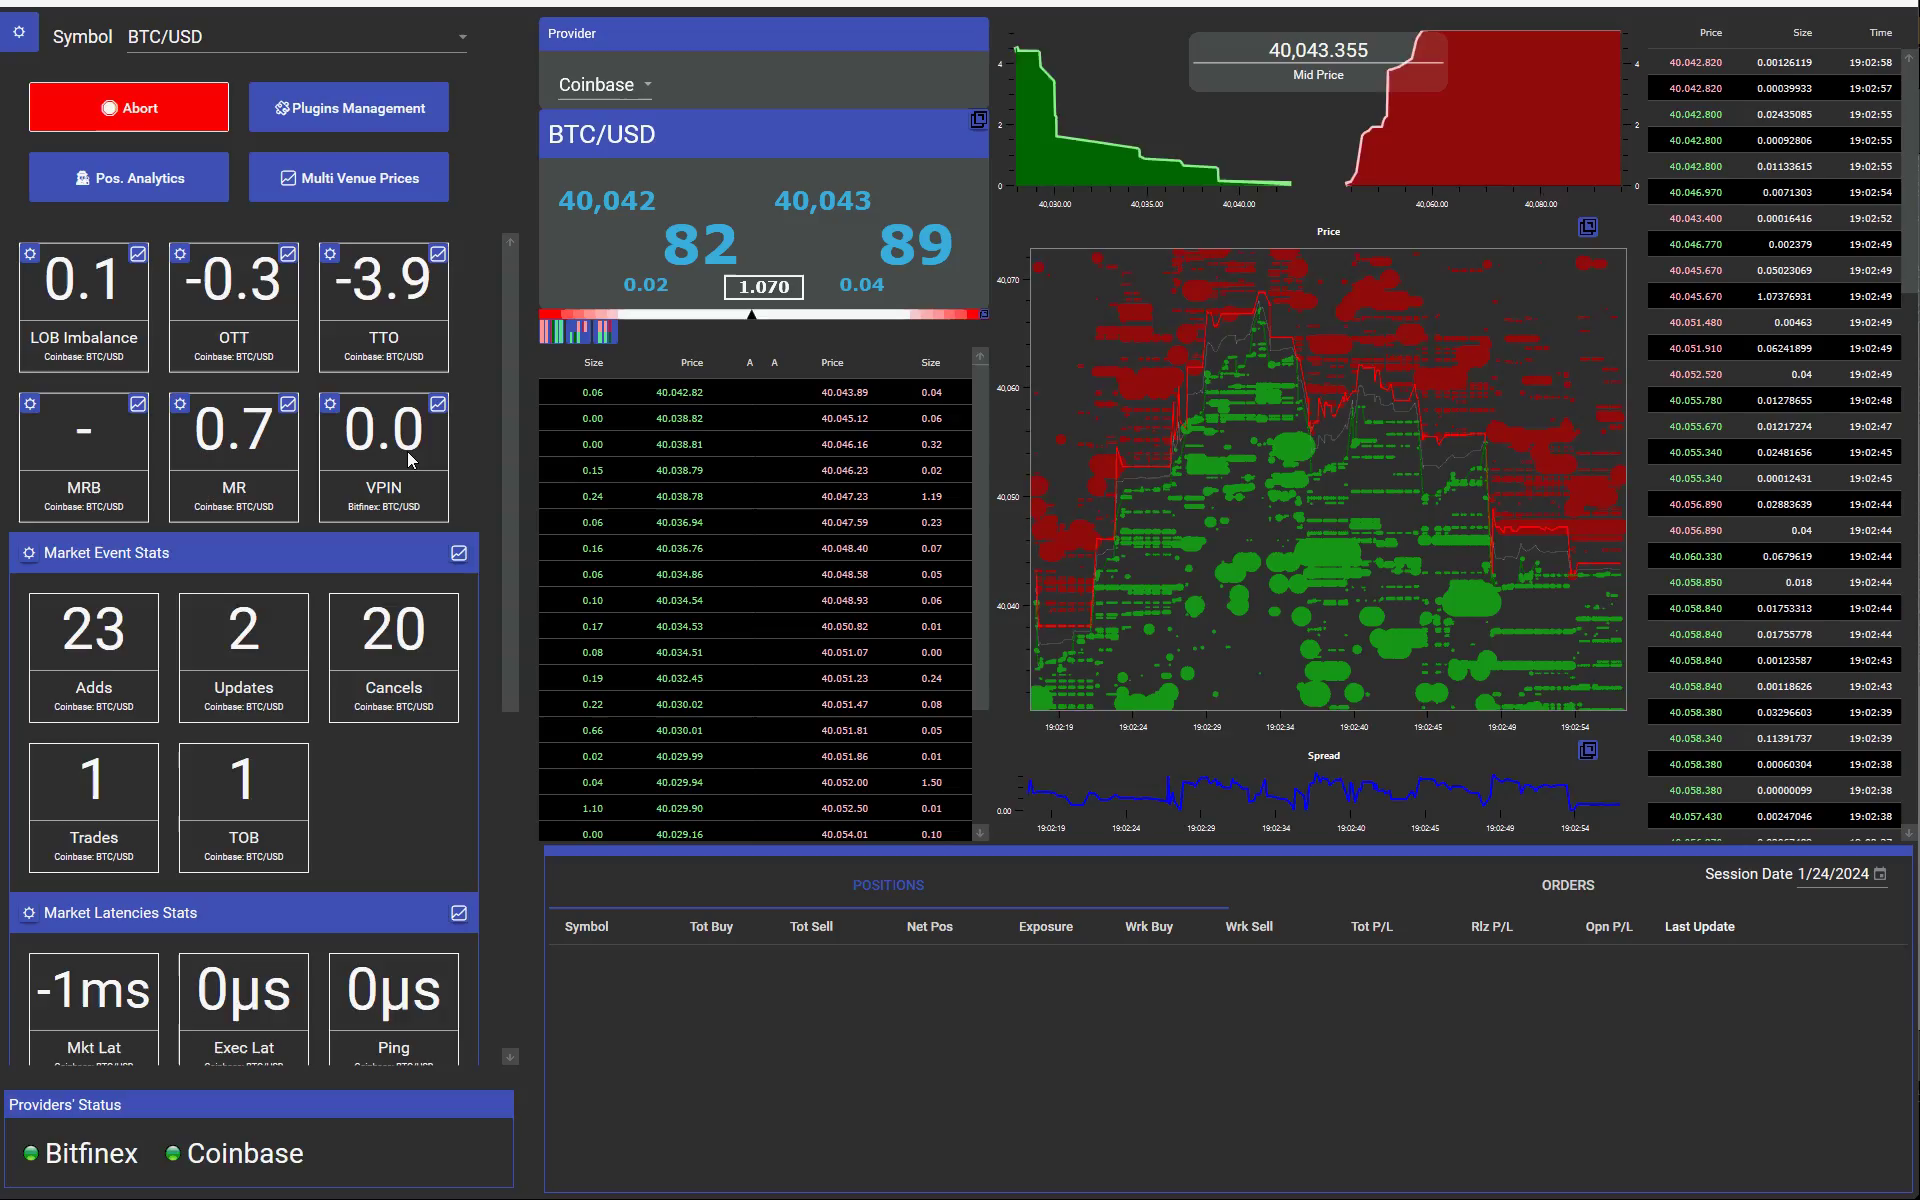
The VisualHFT Predictive Market Analytics dashboard with every tile configured and updating: a quote ladder, a depth chart, a limit order book time series, a time and sales stream, and a column of metric tiles Open guide →
01 · Getting Started VisualHFT docs

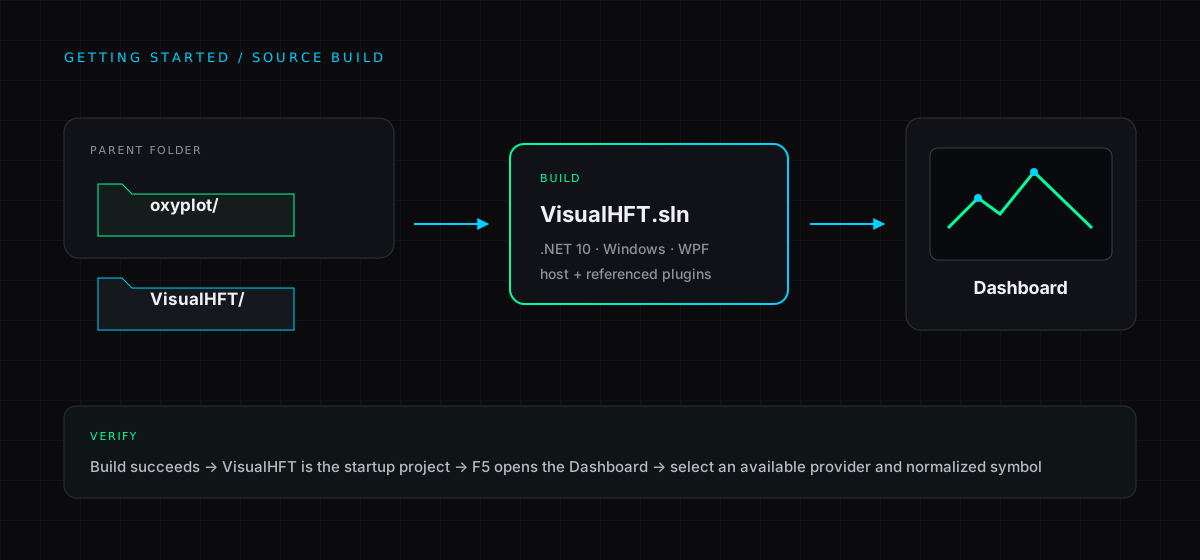
Your first session: from empty dashboard to live data

What to do in the first ten minutes after installing VisualHFT Terminal. How the dashboard is built, how to connect a market connector, how to point each tile at a provider and a symbol, and which plugins are included versus bought separately.

corepro getting starteddashboard
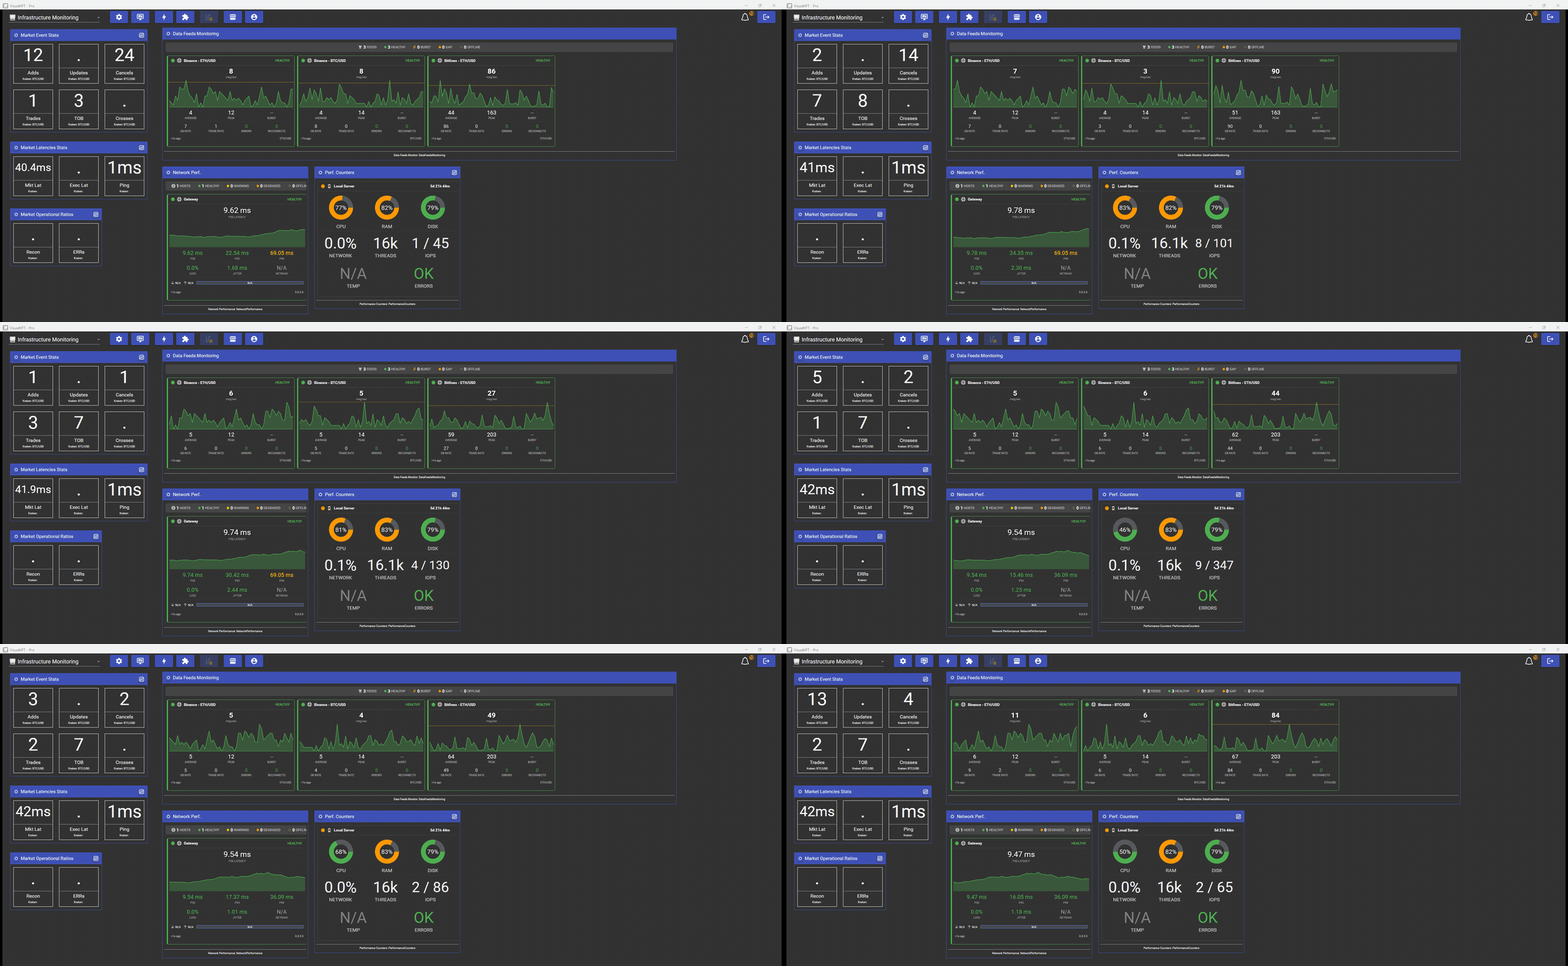
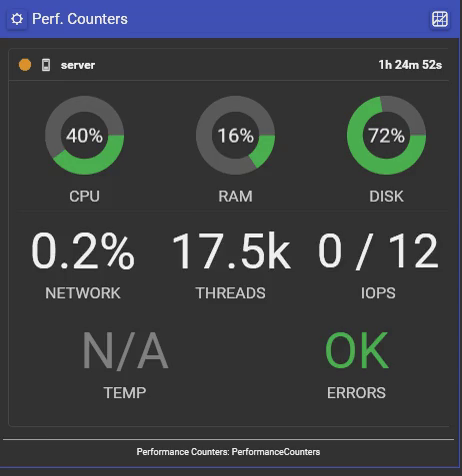
The Infrastructure Monitoring dashboard running live: feed message rates and sparklines moving, network latency percentiles refreshing, the CPU gauge redrawing, and the order-book event and latency counters changing, while Market Operational Ratios holds a dot on both counters because nothing has gone wrong Open guide →
02 · Operating VisualHFT VisualHFT docs

Monitor your trading infrastructure

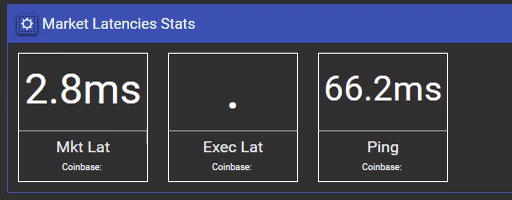
The Infrastructure Monitoring dashboard and the six shipping plugins behind it: feed health, network path quality, remote server counters, exchange latency, operational errors, and order-book event rates. Setup, what each number measures, and how to alert on it.

corepro infrastructuremonitoring
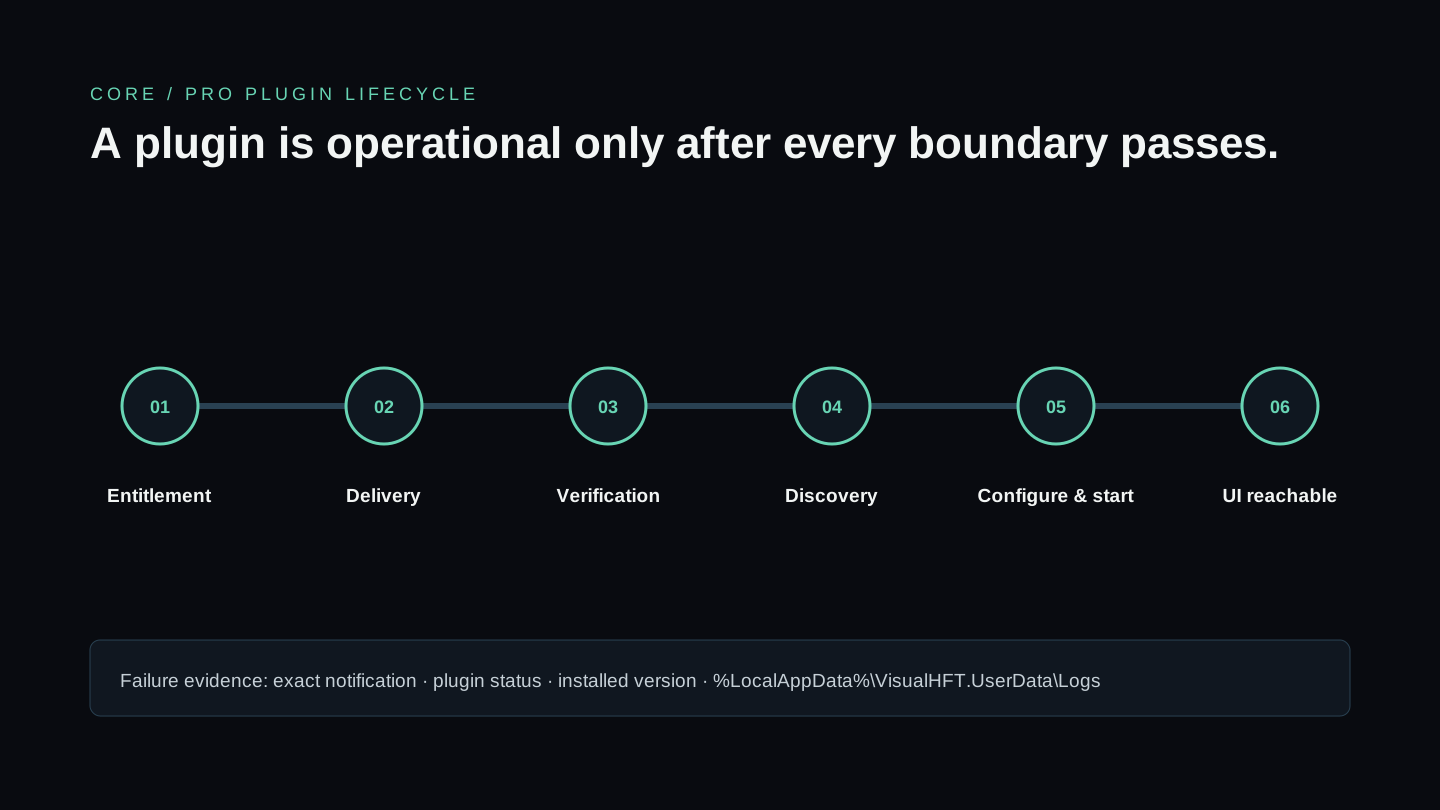
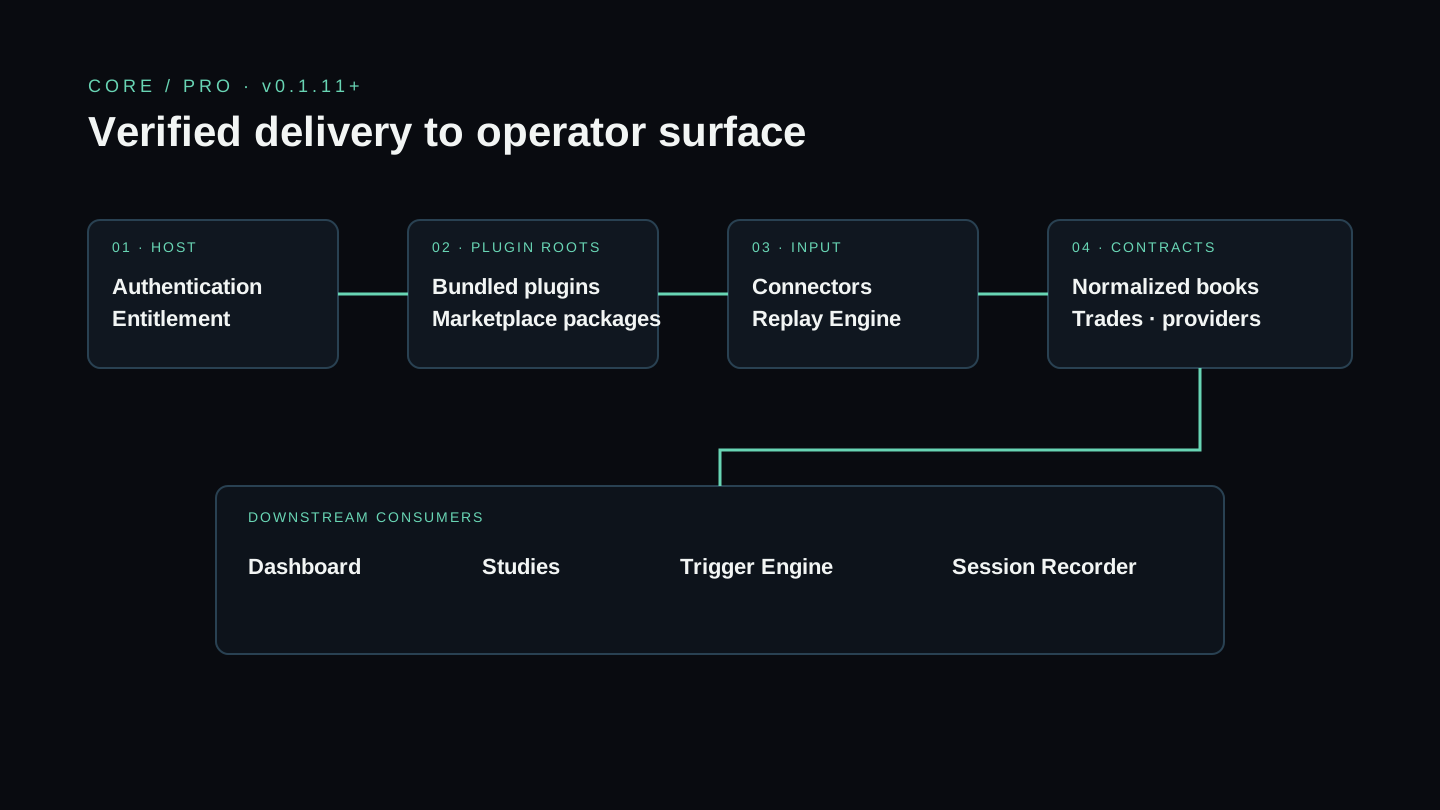
VisualHFT Core and Pro architecture from plugin delivery to connectors, shared data contracts, studies, recording, replay, triggers, and Dashboard surfaces Open guide →
05 · Architecture VisualHFT docs

VisualHFT Terminal architecture overview

Trace the VisualHFT Terminal (Core and Pro) application from plugin delivery through connector, shared market-data, study, trigger, recorder, replay, and Dashboard boundaries.

corepro architecturedata flow
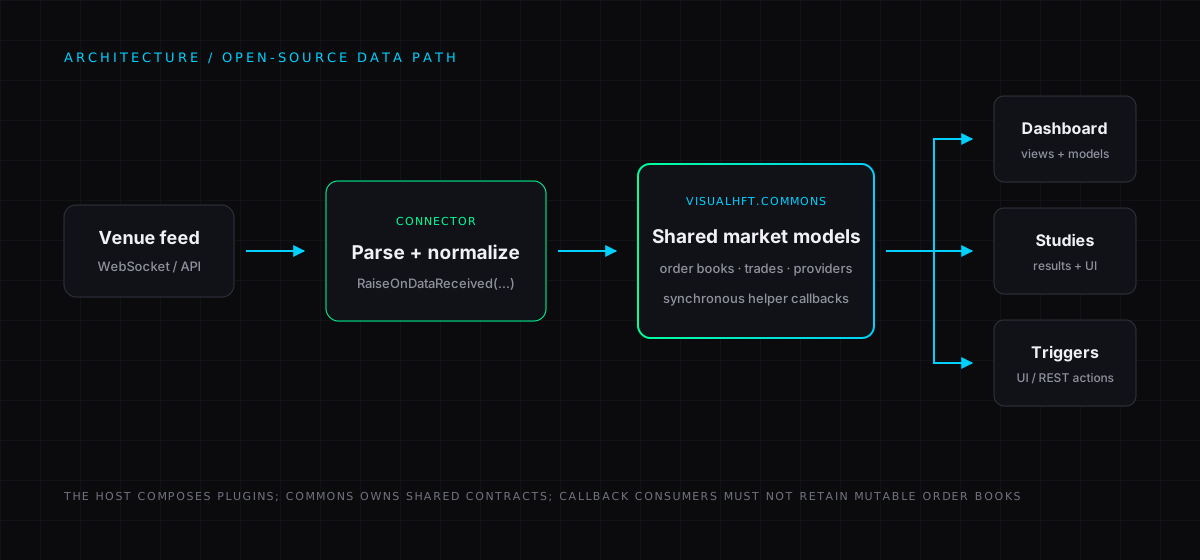
VisualHFT data flow from market connectors into shared models, studies, and dashboard surfaces Open guide →
05 · Architecture GitHub source

Open-source architecture

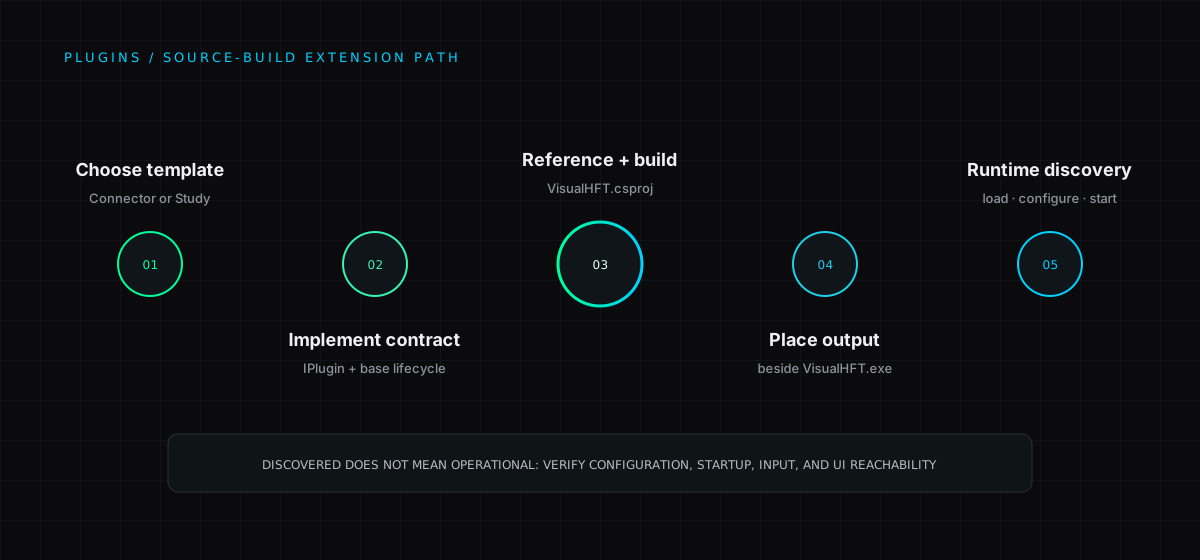
Trace the open-source market-data path, plugin lifecycle, study results, triggers, and dependency boundaries.

open-source architectureopen source
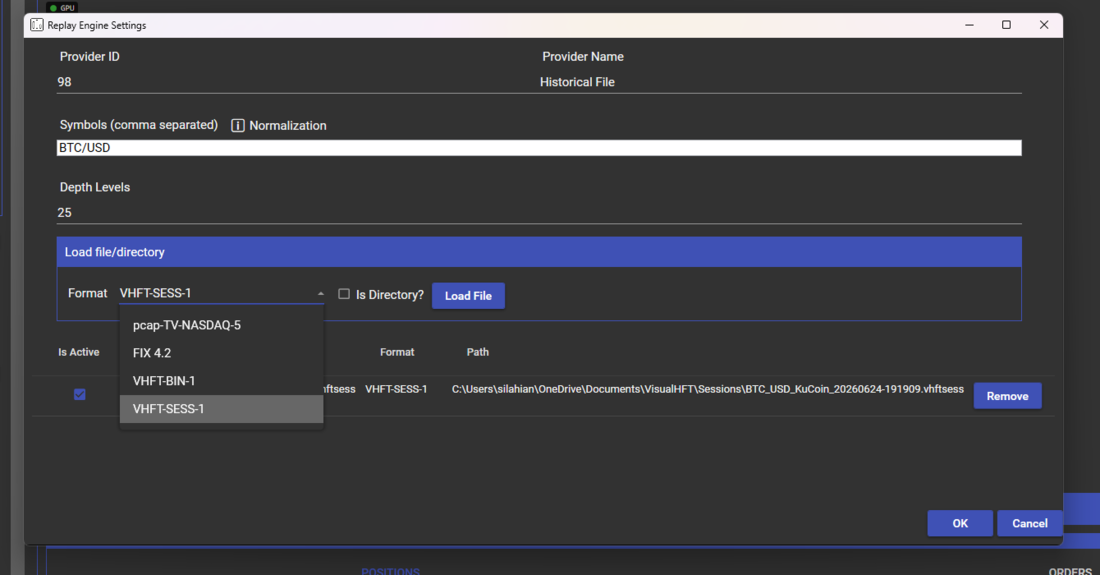
VisualHFT replay formats and ingestion paths Open guide →
06 · Data & Storage VisualHFT docs

Data, storage, and replay

Record VisualHFT Terminal sessions, verify their stream metadata and finalization, then replay them with controlled routing and timing.

pro recordingstorage
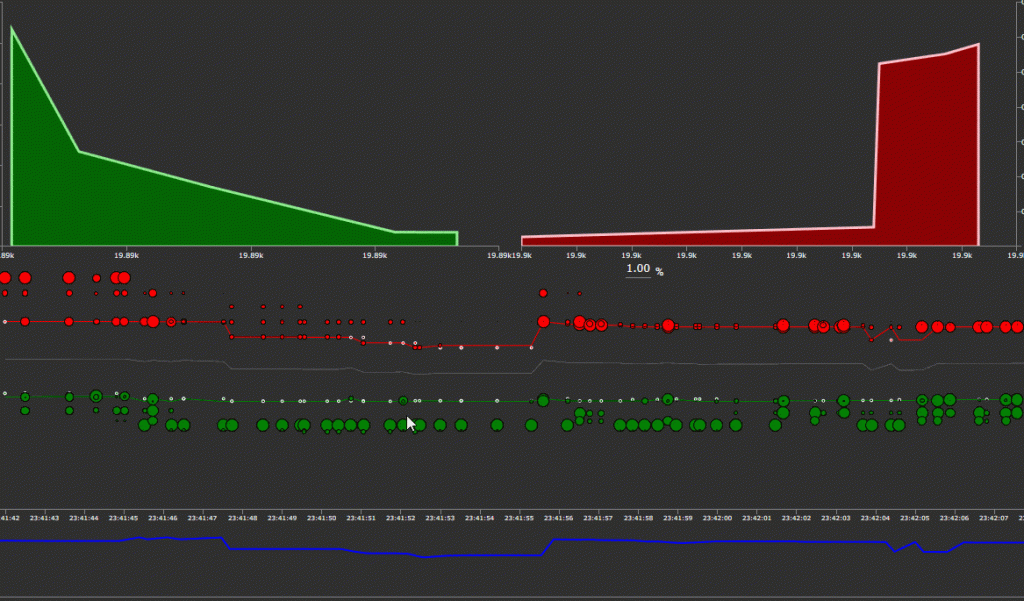
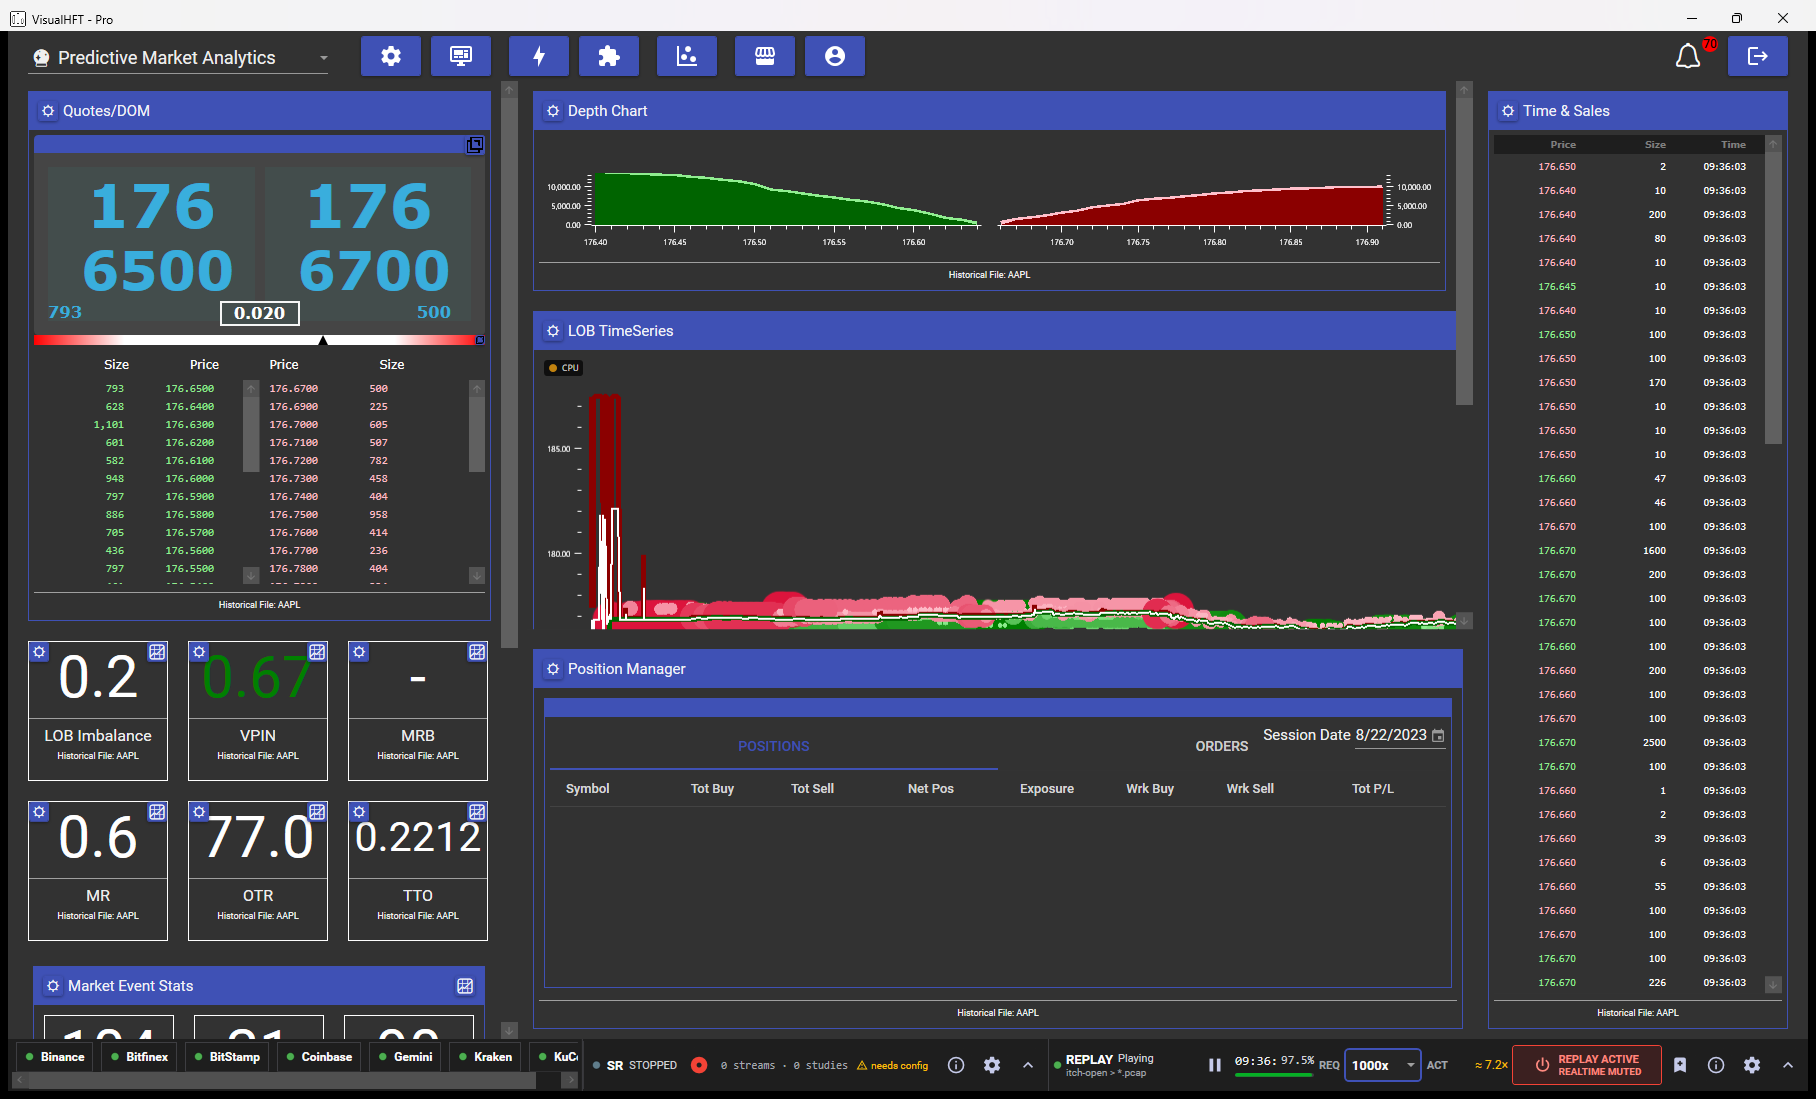
VisualHFT replaying AAPL at the 22 August 2023 NASDAQ opening auction, showing the order book, depth chart, time and sales, and the achieved-speed readout Open guide →
06 · Data & Storage VisualHFT docs

Use your own historical market data

Feed captured market data into VisualHFT Terminal: the four formats the Replay Engine reads, loading a NASDAQ TotalView-ITCH pcap directory, recording your own sessions, writing a converter for any other source, and what the dashboard shows once the tape is playing.

pro historical datareplay

Start with the outcome

What are you trying to do?

Two reading modes

Need the story behind the system?

Docs tell you what to do and what to verify. The Blog carries engineering stories, announcements, market-microstructure education, and the reasoning behind product decisions.

Read the Blog ↗